
The best trading algorithms last for weeks, maybe months if you’re lucky. Eventually the market will adapt and absorb the inefficiencies and the algorithm can’t provide the same good returns. Algorithms in trading need to be constantly evolved with the evolution of the market. ”
CEO at Teza Technologies and Ex Global Head of High Frequency Trading at Citadel
2. Introduction
Welcome into the new age of Trading, made of Intelligent Robots that execute your strategies. Say Hi to this Robot, your new valuable friend!

Arcade Trader is a powerful platform to assist on the research, development, test and the go-live of the algorithmic trading strategies. Arcade is connected to the real-time live data streams from the exchanges to receive all the messages from the market, every single tick. You can design your own strategy with Arcade by using Javascript or Python and go live in few seconds after publishing the strategy in your Investment Profile. Arcade provides all the tools to make Algo Trading a fun experience by letting you focusing on finding your hedge on the market.
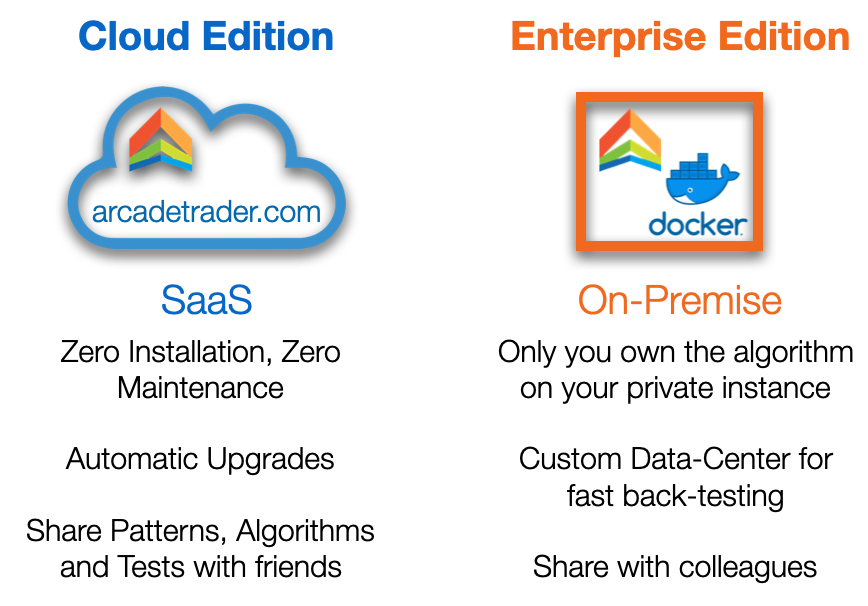
2.1. Availability
Arcade Trader is available in two editions: On The Cloud as SaaS and Enterrpise as On-Premise.
2.2. How does it work?
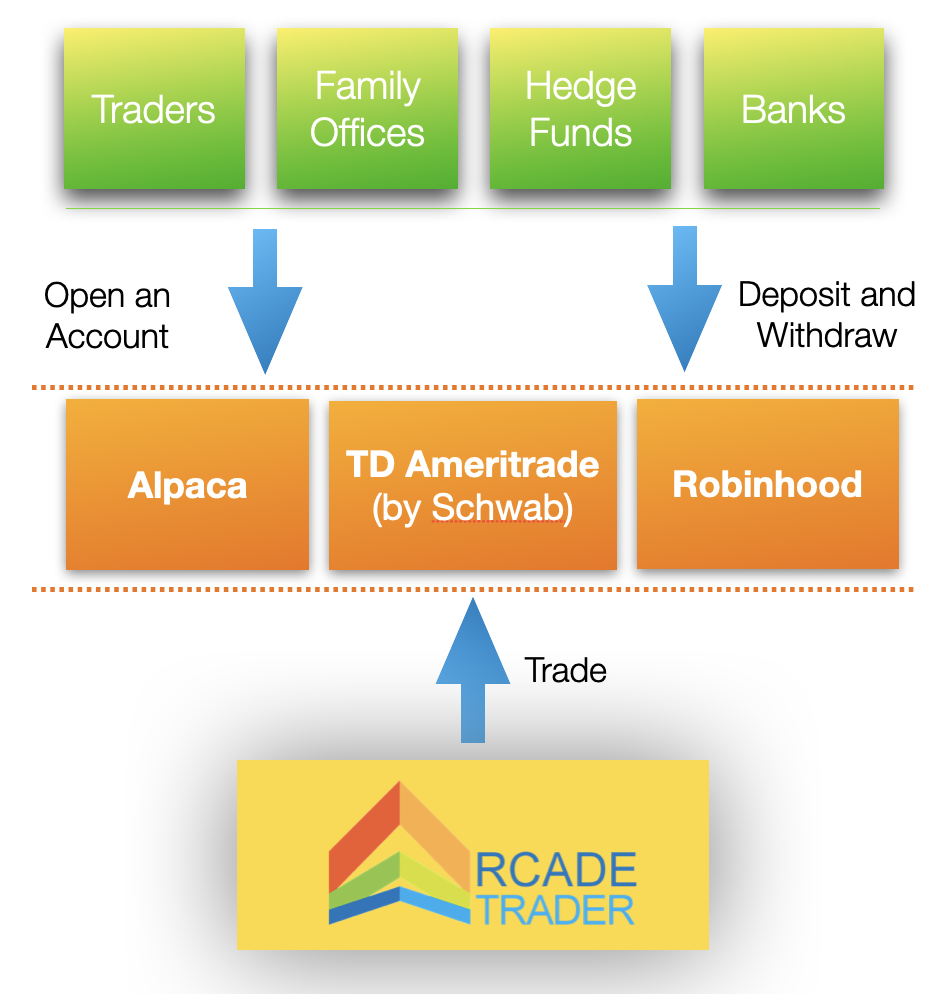
| Arcade Trader is not a Broker. You open an account in your name and let Arcade Trading on it. |
2.3. Accounts
Arcade Trader supports two type of accounts: Live Trading Accounts and Paper Accounts.
2.3.1. Live Trading
This is the typical brokerage account your bank/broker is providing to their customers. You trade real money. Arcade recommends testing your strategies with [Back Testing] first, then with a Paper Account. Check the suggested Algo Trading Lifecycle.
Arcade supports 3 brokers (if your broker provides API, please send a message with a request to integrate it):
|
|
|
|
(Using Official API) |
(Using Official API) |
(Using Not Official API) |
Buy, sell, and short U.S. stocks with zero commissions. Plus, both individual accounts and certain business accounts are supported. Alpaca Securities LLC is a FINRA-registered broker-dealer designed for algorithmic trading. Alpaca Securities is also a member of SIPC - securities in your account are protected up to $500,000#1. |
With TD Ameritrade not only can you trade commission-free online, but you get access to all our platforms and products with no deposit minimums, trading minimums, or hidden fees. TD Ameritrade was named Number 1 Overall Broker in the StockBrokers.com 2020 Online Broker Review. TD Ameritrade is part of Charles Schwab Bank.#2 |
Robinhood’s mission is to democratize finance for all. We believe that everyone should have access to the financial markets, so we’ve built Robinhood from the ground up to make investing friendly, approachable, and understandable for newcomers and experts alike.#3 |


2.3.2. Paper Account
It’s great for testing because it’s a brokerage account with virtual money. Usually you can define how much virtual money you want to set and you can reset this amount infinite times. It behaves very similar to a real brokerage account, but every time you buy and sell stocks, no real money is used. That’s why this is great for testing your strategies before going live. Not all the brokers provide Paper Accounts or sometimes they don’t provide API access to the Paper Account. Testing with a Paper Account is not a substitute for real trading and performance may differ. Specifically, paper trading does not account for:
-
Market impacts of your orders
-
Information leakage of your orders
-
Price slippage due to latency
-
Order queue position (for non-marketable limit orders)
-
Price improvement received
-
Regulatory fees
-
Dividends
Arcade supports 2 Paper Accounts:
|
|
Arcade Trader Paper Account |
|
Create a Paper Account with virtual money in it. This is the best way to learn and test your ideas with algorithms. Everybody can create a Paper Trading account with Alpaca in a few minutes. Works only when the market is open and during Extended Hours. This is not real money, you can play as much as you want without all the risks you have with Live Trading#1. |
It’s used automatically every time you’re doing back-testing. It works at any time even when the market is closed. |

Unfortunately, TD Ameritrade has a Paper Account, but it’s not accessible via API. For this reason can’t be used with Arcade Trader.
#1 Alpaca provides both Live and Paper Trading. Live trading is provided by Alpaca Securities LLC ("Alpaca"), while Paper Trading is offered by AlpacaDB, Inc.
#2 Brokerage services provided by TD Ameritrade, Inc., member FINRA/ SIPC. TD Ameritrade is a trademark jointly owned by TD Ameritrade IP Company, Inc. and The Toronto-Dominion Bank. © 2020 TD Ameritrade.
#3 Robinhood means Robinhood Markets and its in-application and web experiences with its family of wholly owned subsidiaries which includes Robinhood Financial, Robinhood Securities, and Robinhood Crypto.
2.4. Markets
Arcade supports only the US Stock Market. It’s in the roadmap to support FOREX, Crypto and foreign stock markets.
2.4.1. US Stock Market
US Stock Market is open every business day from Monday to Friday from 9:30 am to 4:00 pm New York Time (EST). The market is closed for 9 federal holidays per year, including New Year’s Day, Martin Luther King Jr. Day, Presidents’ Day/Washington’s birthday, Good Friday, Memorial Day, Independence Day, Labor Day, Thanksgiving and Christmas.
Additionally, these markets have reduced hours on three days per year, including the day before Independence Day, the day after Thanksgiving and on Christmas Eve.
To view the calendar for the current year, check out the NYSE Trading Calendar.
Arcade Platform receive data from the exchanges from 04:00 am to 08:00 pm. Check your broker about the trading hours and any limitations about trading during extended hours.
Extended Hours
Pre-market trading in the United States usually runs between 4:00 am and 9:30 am Eastern Time (EST) and After-hours trading typically runs from 4:00 pm to 8:00 pm Eastern Time (EST).
Some investors in the United States can start trading from 4:00 am, but the majority of extended trading occurs between 8:00 am and 9:30 am (EST). Similarly, investors may trade until 8:00 pm after the stock exchanges close, but the majority of extended trading occurs before 6:30 pm.
Extended Trading Risks
The U.S. Securities and Exchange Commission (SEC) highlights several risks associated with extended trading, including:
-
Limited Liquidity: Extended hours have less trading volume than regular hours, which could make it difficult to execute trades. Some stocks may not trade at all during extended hours.
-
Large Spreads: Less trading volume often translates to wider bid-ask spreads, which can adversely affect the market price for execution, making it harder to execute orders at favorable prices.
-
Increased Volatility: Less trading volume often creates an environment for greater volatility given the wider bid-ask spreads. Prices can move drastically in a short amount of time.
-
Uncertain Prices: The price of a stock trading outside of regular hours may not closely match the price during regular hours.
-
Professional Competition: Many extended trading participants are large institutional investors, such as mutual funds, that have access to more resources.
2.5. Algo Trading Lifecycle
Before trading real money, be sure you’ve done your homework. Trading is a risky activity, and our job is to help you find a hedge on the market. This is why it’s so important to have a tool that allows you to develop your idea in short time and test it properly before going live.
Successful Algo Traders helped us to come up with this diagram from the beginning of an idea through the final go-live.
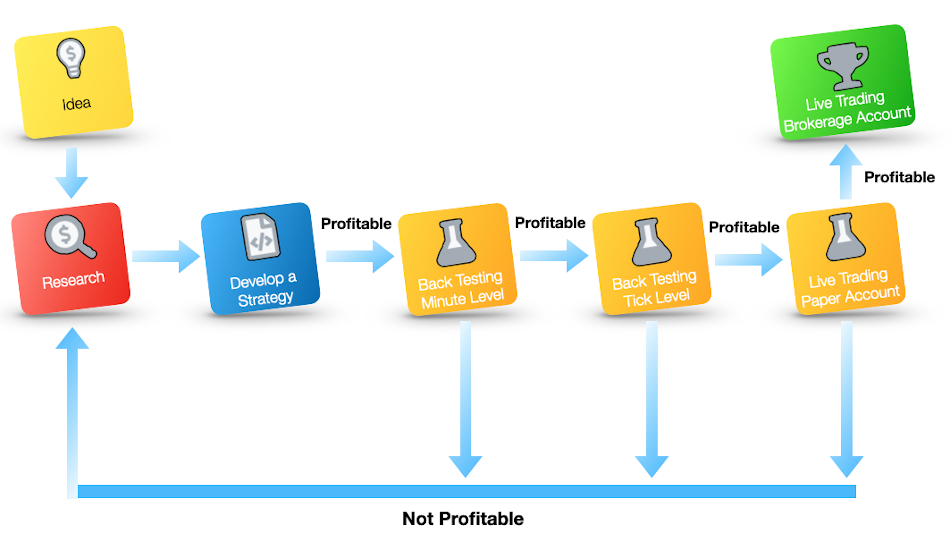
Once you’ve found your hedge on the market and your algorithms are gaining profit consistently, it’s time to improve the algorithm with new idea or with different configurations.
| Arcade doesn’t enforce using this lifecycle, you can have your own. |
3. Sign Up
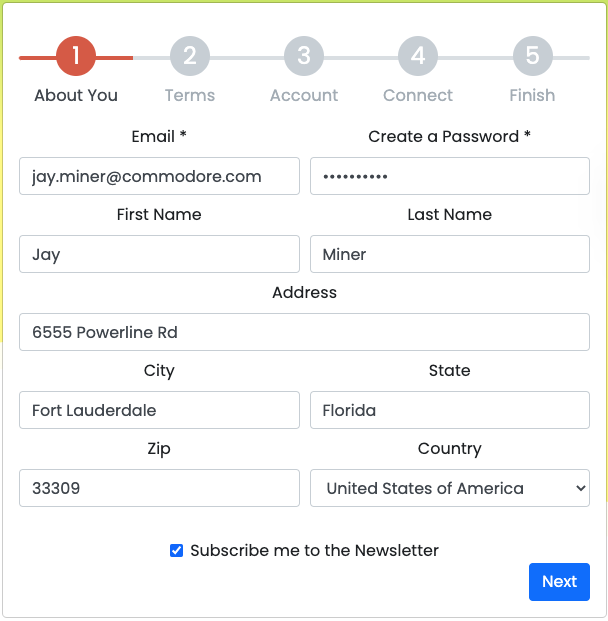
Creating a new account with Arcade is FREE and takes a minute.
(1) Goto the Sign Up page.
(2) Fill the form about you, and then click Next.
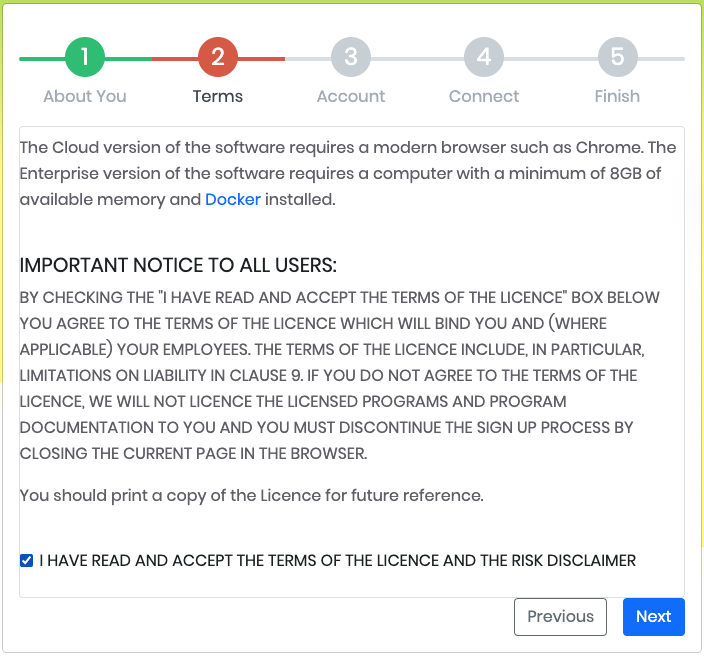
(3) Be sure to read the License agreement and the Risk Disclaimer and if you’re good with them, click on "I HAVE READ AND ACCEPT THE TERMS OF THE LICENCE AND THE RISK DISCLAIMER" and then click Next.
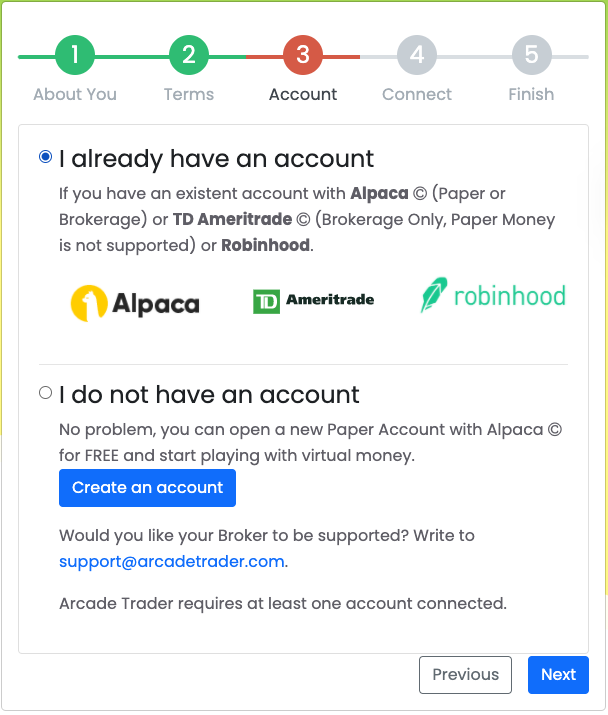
(4) If you don’t have an account either Alpaca, TD Ameritrade or Robinhood, open a new account with one of them.
They all have FREE subscription and they both offer Zero commission trades.
If you want to just learn and backtest your algorithms on a paper account, please create a FREE account on Alpaca.
Once you’ve done, click Next.
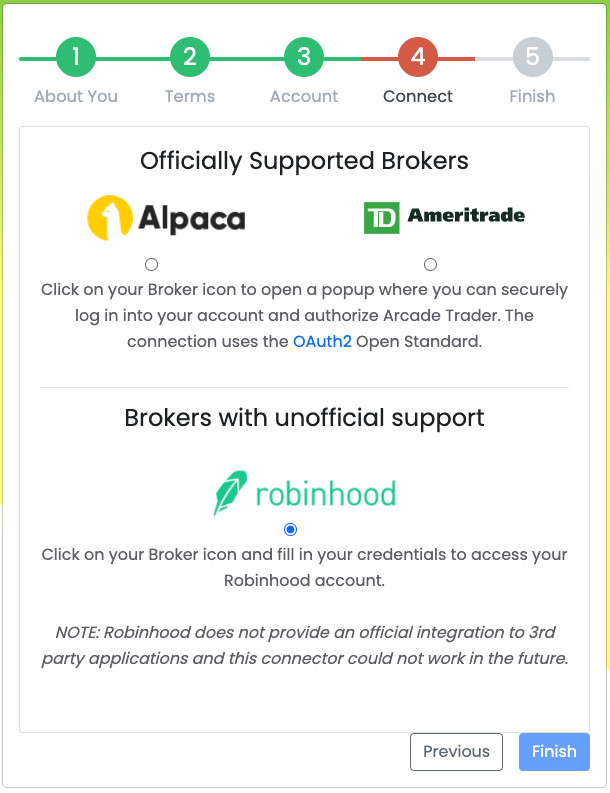
(5) Select your broker between Alpaca, TD Ameritrade or Robinhood and then click on Request Authorization button.
A popup will be open on your broker to request the authorization by Arcade Trader application.
(6) All the brokers require granting for permissions to Arcade Trader in order to access to your account.
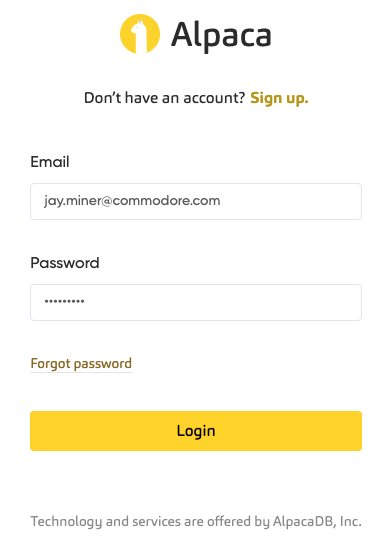
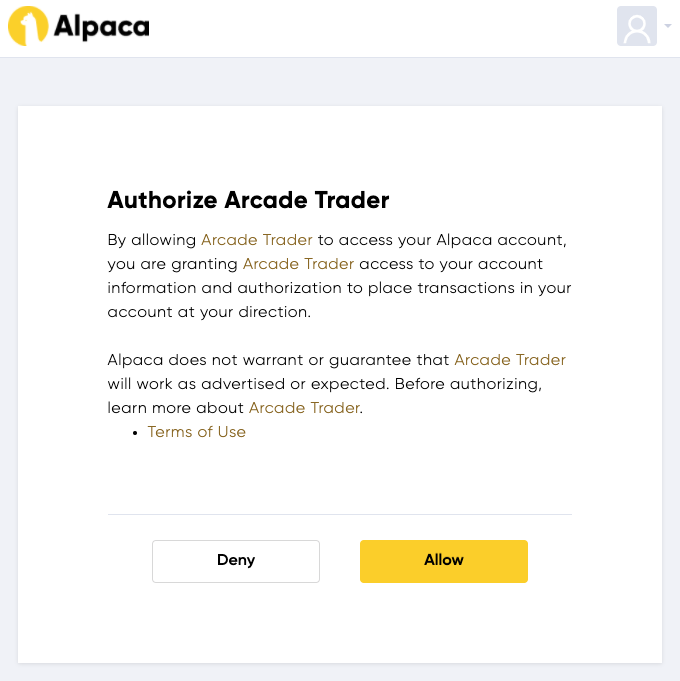
Via Alpaca
(6.1a) Log in your Alpaca account
|
(6.2b) Click on Allow
|
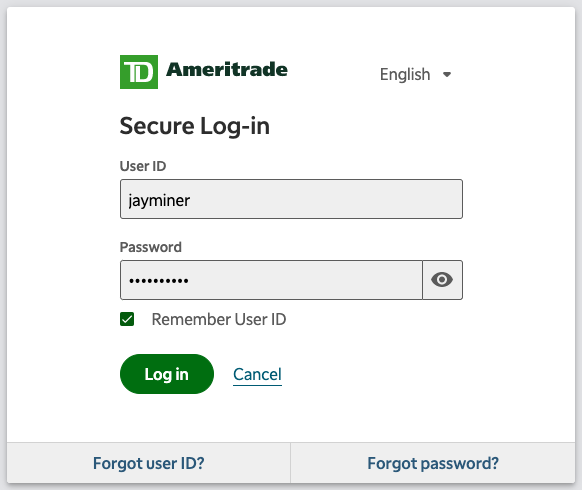
Via TD Ameritrade
(6.1b Log in your TD Ameritrade account
|
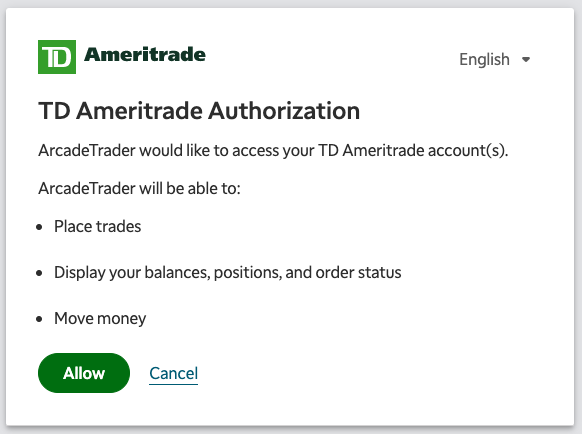
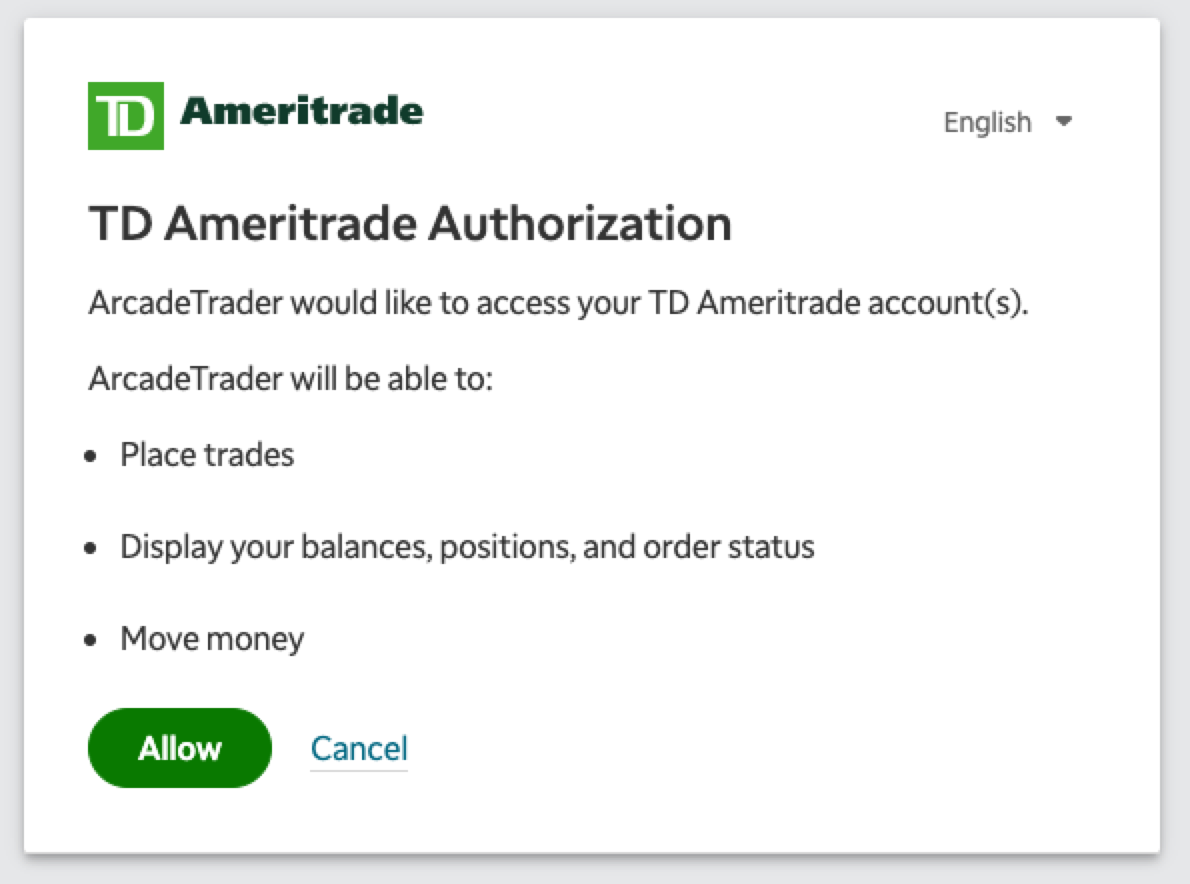
(6.2b) Click on Allow
|
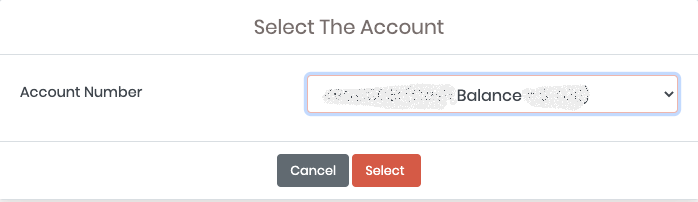
(6.3b) Select the TD Ameritrade brokerage account to connect with Arcade Trader, then press Select.
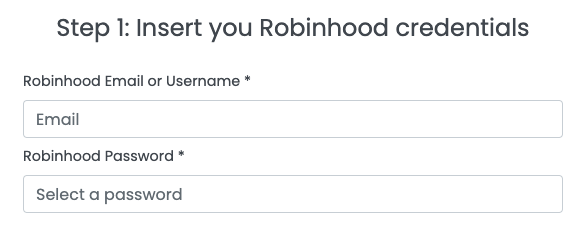
Via Robinhood
(6.1c Log in your Robinhood account
|
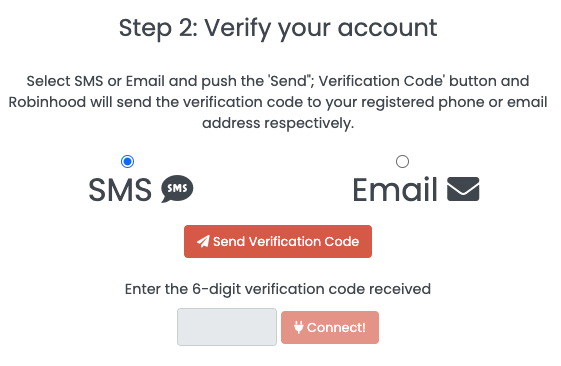
(6.2c) Verify your account via SMS or Email
|
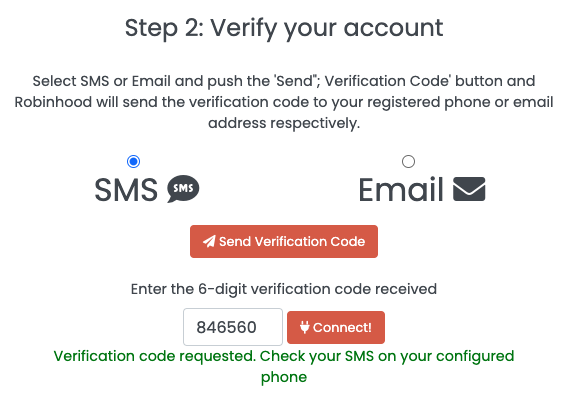
(6.3c Enter the received code
|
(6.4c) Select the Robinhood brokerage account to connect with Arcade Trader, then press |
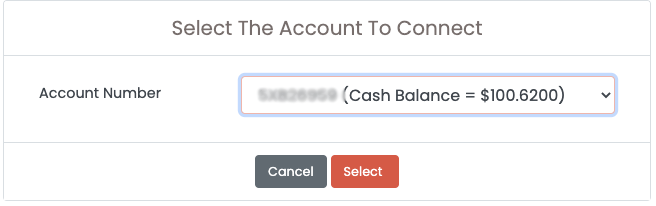
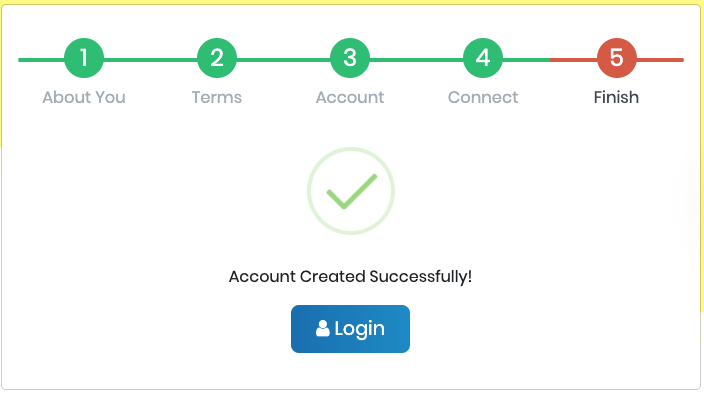
(7) You’re connected!
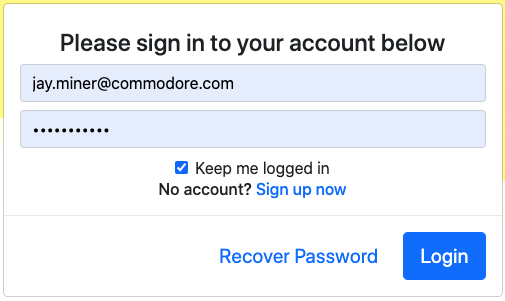
4. Login
Once you have created your account, login in Arcade by using the top right blue "Login" button from the main web site https://arcadetrader.com:

Now enter the email that you used for the registration and the password.
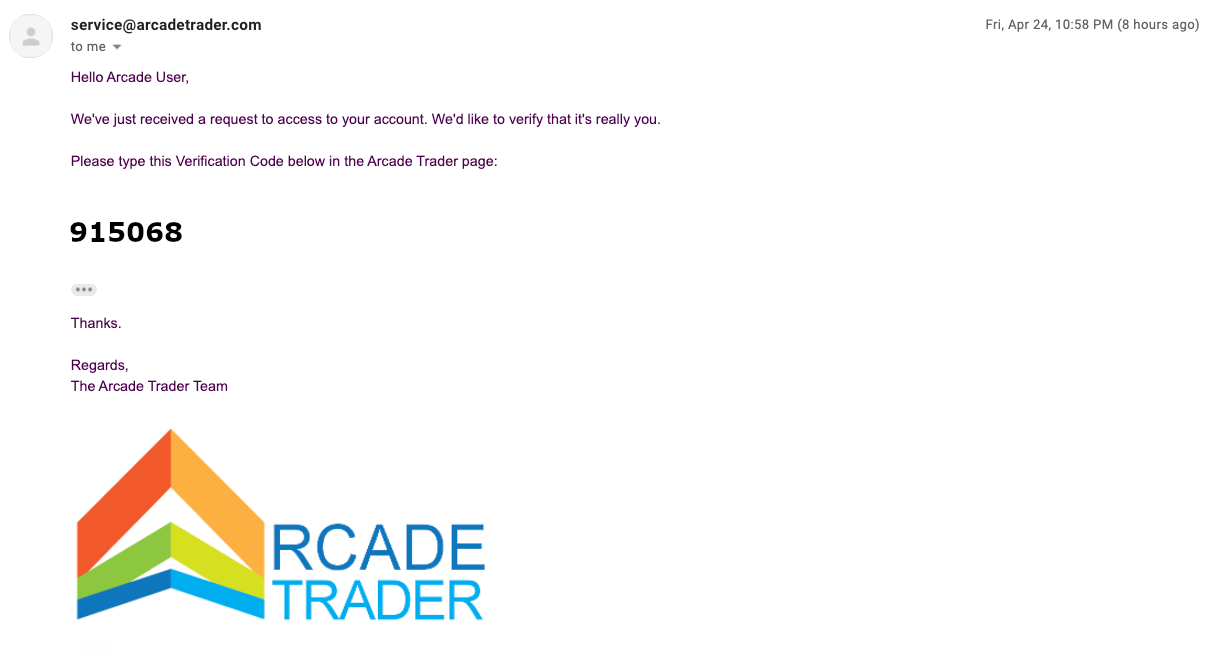
4.1. Verification of Device
The first time you login from a device (Computer, Mobile phone, etc.) a 2 Factor Authentication is used to verify that is really you. In this case an email has been sent to the email address you’ve used for the registration. The message will look like the following:
If you can’t find the email after 1 minute, please check your spam folder. Now copy and paste the 6-digit number into Arcade Verification form:
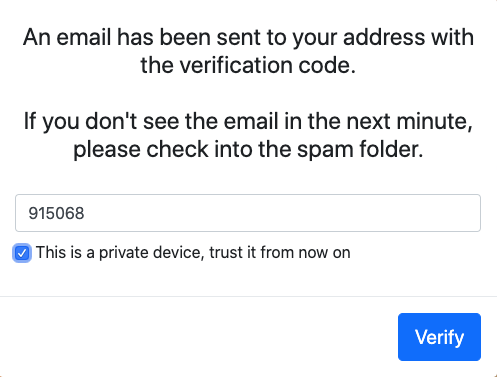
You can trust the current device to avoid asking for a verification all the time. Do this only if nobody is using your browser.
Even if the device has been trusted, a further verification could be requested for security reason. Check more about Security.
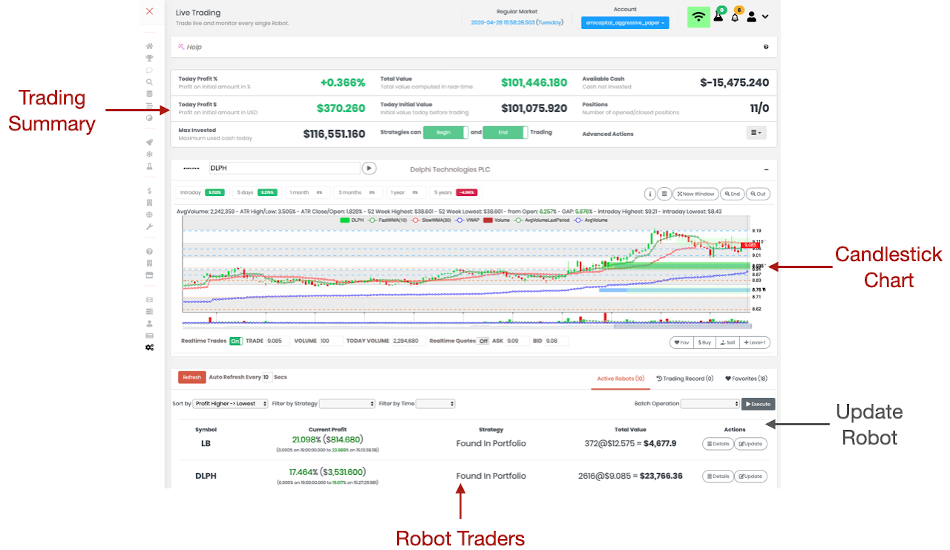
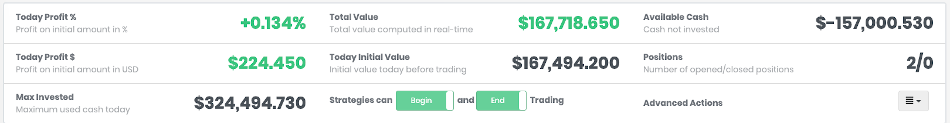
5. Home Page
Arcade Home Page provides a summary of your day trading. The first box contains the accounts and their profit/loss. For the selected account, you can see the other 3 widgets containing the Historic Profit/Loss for the day, the Open Positions and the submitted Last Orders.
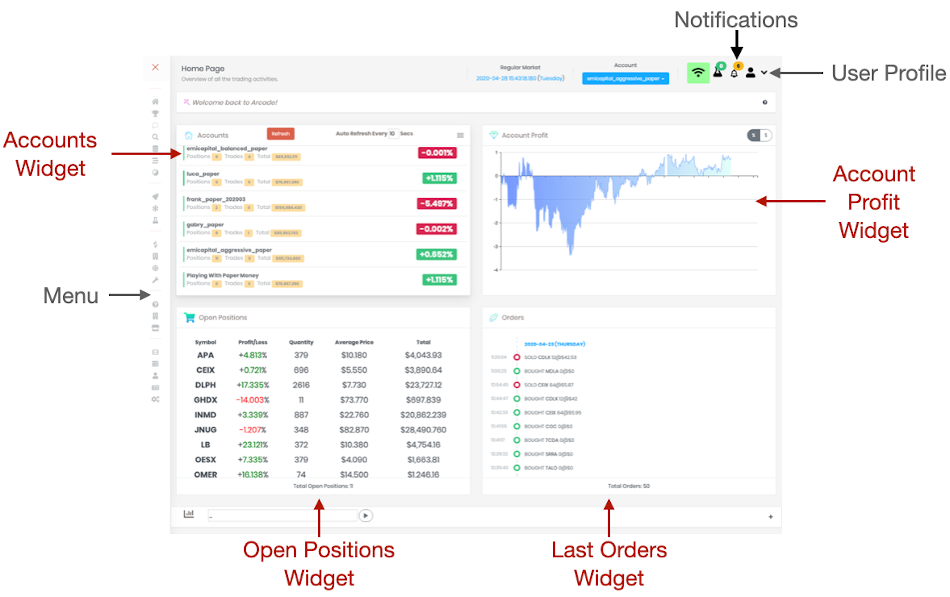
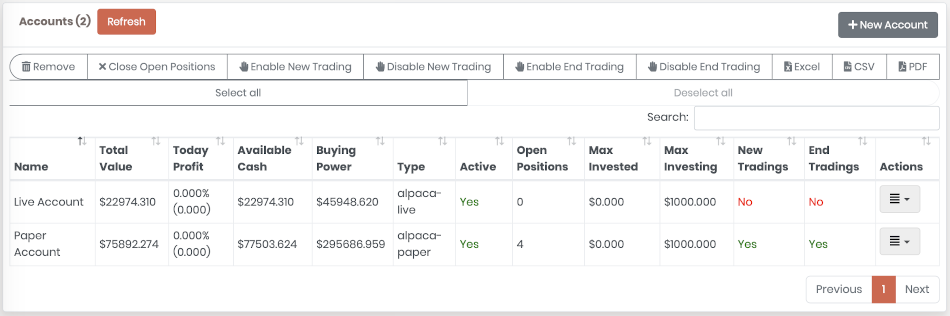
5.1. Accounts Widget
This widget contains all the connected accounts. It includes number of open positions, total number of trades and portfolio value.
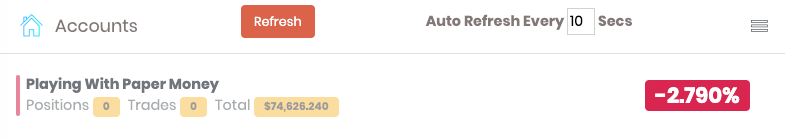
In case of profit, the percentage is green, red for a loss and gray if it’s zero. The bar on the left of the account name can be green = the account is active and red = the account or trading is suspended.
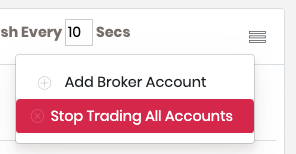
From this widget, you can manually refresh the account information and modify the refresh settings. In the widget menu you can add a new Broker Account and "Stop Trading All Accounts" to suspend immediately the trading activities. By pressing this button, after a confirmation, Arcade sells all the open positions for all the accounts and suspend the trading for the rest of the day. |
|
5.2. Account Profit Widget
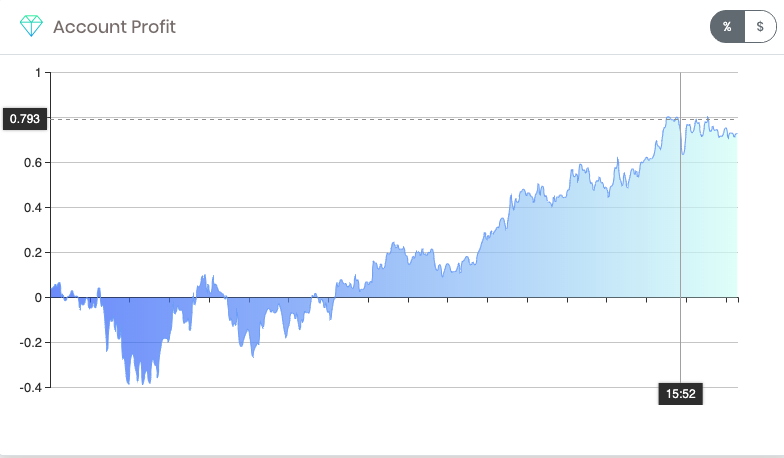
This widget is useful to understand how your day is going. The chart records your profit/loss every minute. By default, the percentage is displayed, but you can click on the "$" button to have the currency amounts.
5.3. Last Orders Widget
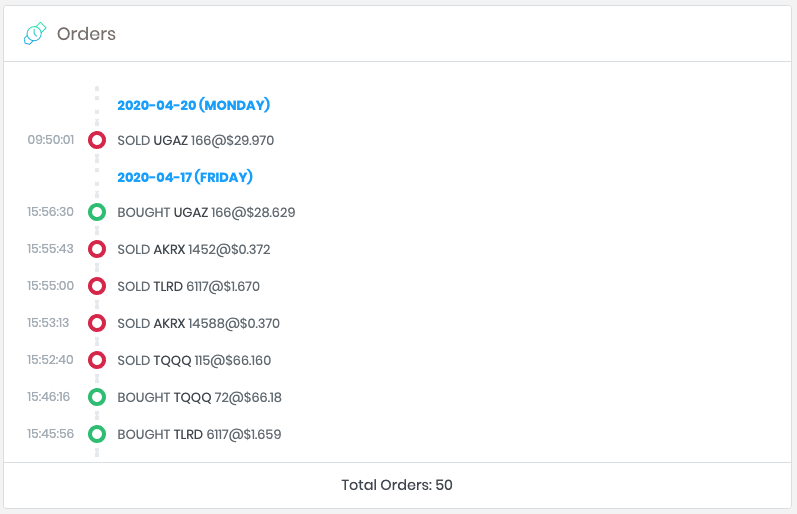
This widget contains last orders, grouped by day. Green circles are BUY operations, red circles are SELL operations. You can click on the symbol in the order to open the CandleStick Widget chart right at the date of the order.
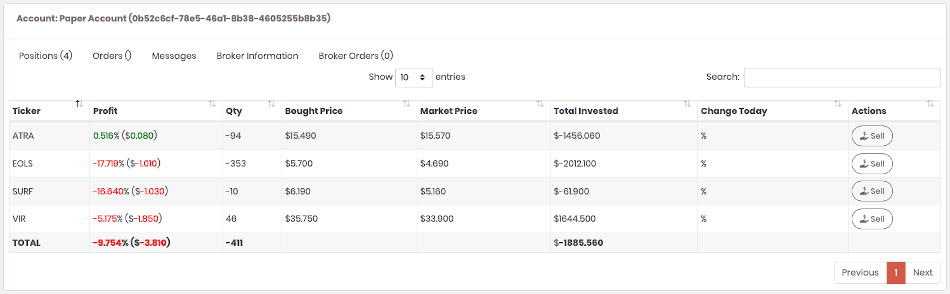
5.4. Open Positions Widget
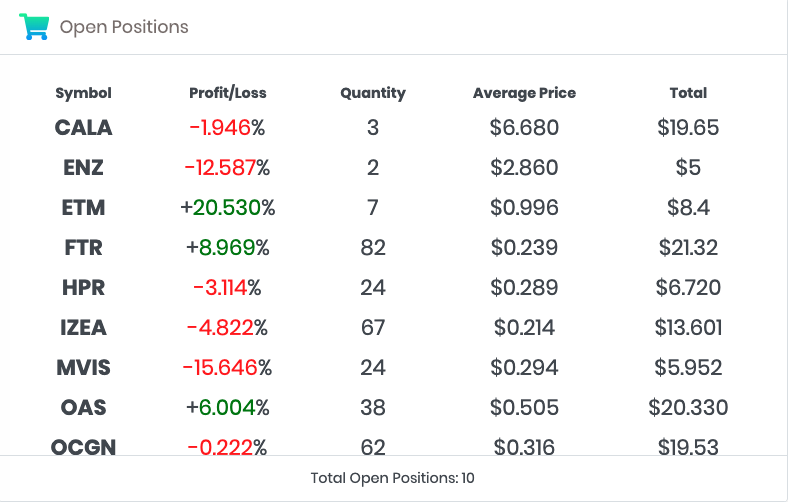
This widget contains all the open positions for the account with relative profit/loss, number of stocks, average price and total.
You can click on the symbol in the position to open the CandleStick Widget.
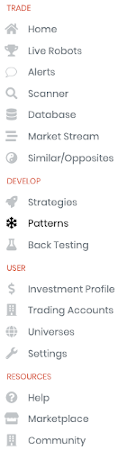
5.5. Menu
|
The trading screens have a lot of information to display so the menu controls are compacted to simple icons when not in use. On the left you can see the default compacted menu and on the right the expanded menu. |
|

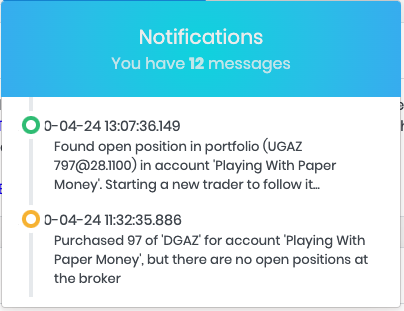
5.6. Notifications
During the trading activity you’re going to receive many notifications about when a stock has been purchased or sold. These are common messages for trading, but others are less common and deserve to be kept in the Notification Box you can find on top right of your screen.
Some messages that are contained in the Notification box are:
-
Disconnection with the real-time market
-
Divergences between the order and the execution
6. Investment Profile
The investment Profile is the most important configuration in Arcade for the live trading. Here you can setup your robots, their configuration and the trading limits. Under this page you can find the following:
-
Max investing amount (the same found in Account settings). If zero, the available cash or buying powe is used based on the setting in the Account configuration.
-
Max Loss/Profit of the day. This sets the boundaries when Arcade should start selling all the open positions and close the trading activity for the day.
-
End of day trading, is the time of day when Arcade should start selling all open positions for strategies with a day trading scope.
-
Robot Strategies, contains the configuration for the automatic strategies (see below)
-
Can Begin Trading is a switch that allows you to turn off starting of new robots
-
Can End Trading is a switch that allows you to turn off ending of existing robots
-
Manual Strategies, contains all the manual strategies you can pick when you buy a stock manually
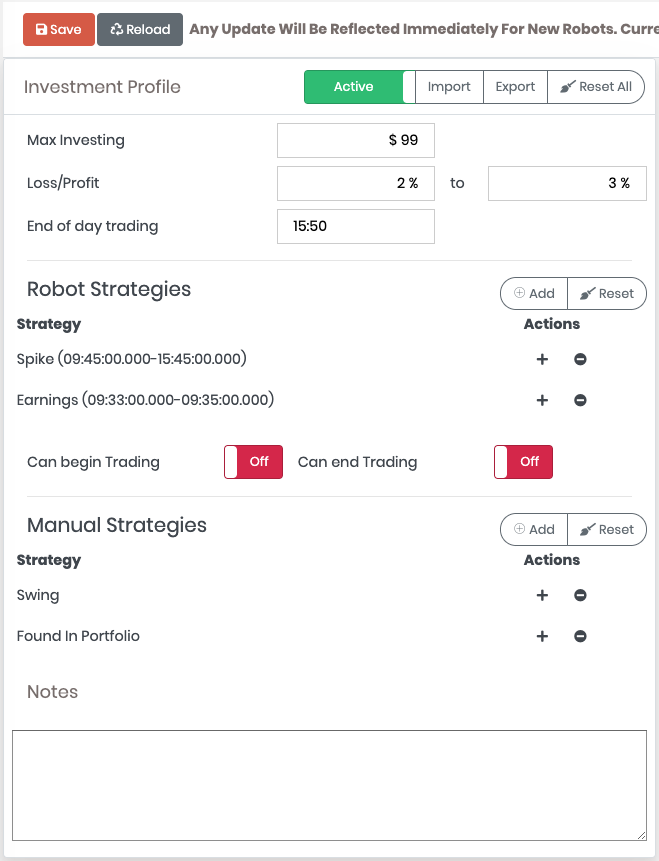
6.1. Robot Strategies
This is the core of the configuration for Arcade Live Trading. Once you’ve designed, implemented and tested your strategy, it’s time to run them live. It’s always wise to try new strategies on a Paper Account first. You can have many strategies running in parallel based on your subscription. Click on the strategy name, and the selected strategy configuration will be displayed on the right panel.
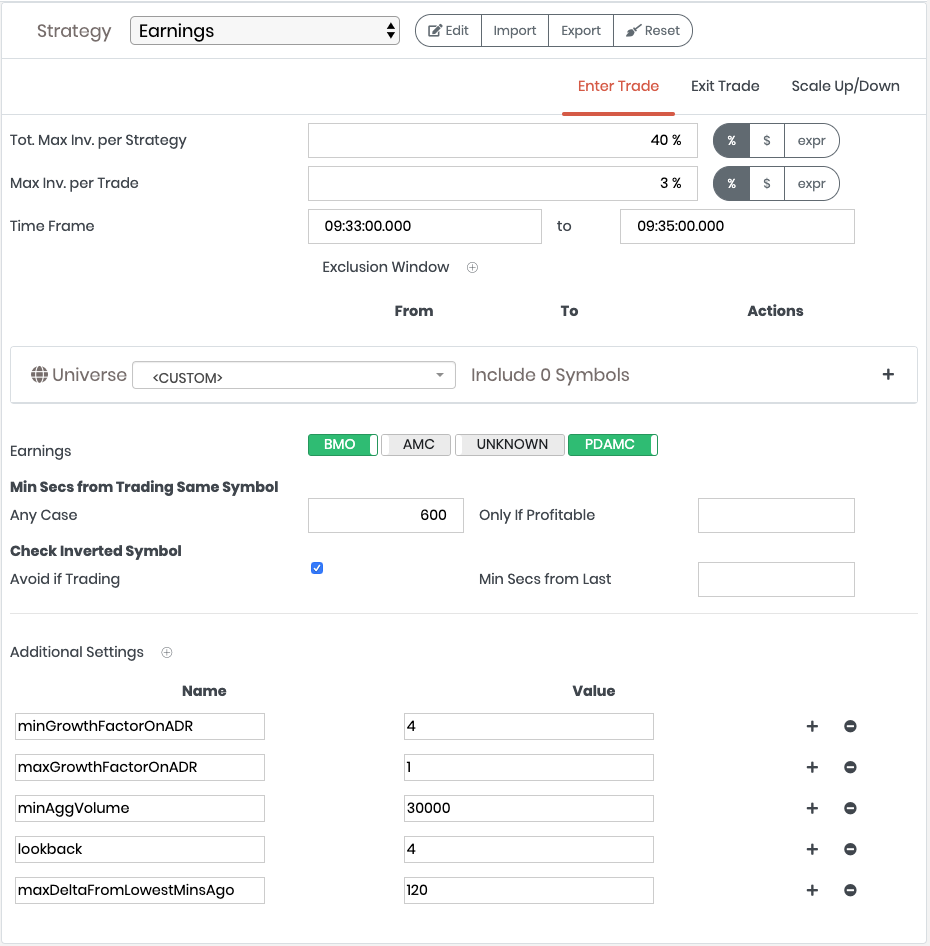
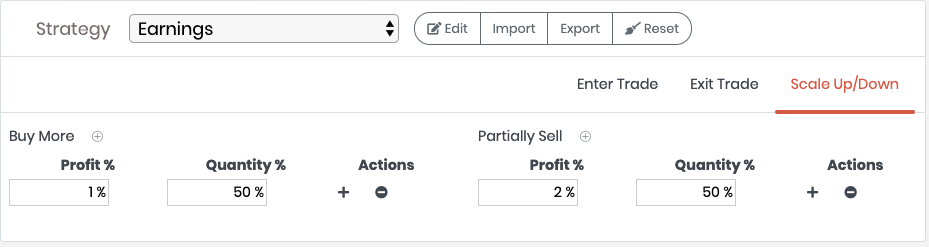
6.2. Strategy Enter
Strategy Enter is the main configuration for the strategy. Here you can set the strategy parameters that are passed to the strategy implementation.
-
Tot. Max Inv. per Strategy, this is the maximum allowed investment amount for a selected strategy. It’s computed as the sum of all the investment capital used by all robots executing the strategy. This is useful to limit the amount of money working on a single strategy. For example, imagine a strategy based on trading immediately after company earnings are announced. Some days there will be no company earnings at all and on other days are full of company earnings. This configurable limit will allow multiple strategies to work concurrently - ensuring that each strategy is apportioned with enough capital to operate. The amount can be expressed in:
-
percentage (%) from the total. 5% means 5% of the total amount available to invest
-
amount ($) amount in currency to invest. 500 means $500
-
expression (expr) is a Javascript expression
-
-
Time Frame, it’s the time frame from/to when the robot can be started
-
Max Inv. per Robot, it’s the maximum amount of money a single robot instance can use See Score for more information about how the total amount per trade is computed. The amount can be expressed in:
-
percentage (%) from the total. 5% means 5% of the total amount available to invest
-
amount ($) amount in currency to invest. 500 means $500
-
expression (expr) is a Javascript expression
-
-
Time Frame, it’s the time frame from/to when the robot can be started. You can setup optional exclusion window inside the time frame. For example, your strategy could start from 10:00am to 3:00pm, but skipping 1:00pm to 2:00pm. This is the exclusion window. The strategy beginTrading() function will be not called outside this time frame
-
Universe, select the universe of stock tickers to be used for the strategy
-
Earnings, If one or more of the earnings switches are enabled, Arcade will add all the symbols that have earnings on the current day into the include list of symbols extracted from the selected Universe. To check which stocks have Earnings, use the Earnings page. Enable the switches based on the type of earnings:
-
BMO Before Market Open
-
AMC After Market Close
-
Unknown The time is unknown, or the earnings meeting could have been canceled or postponed
-
PDAMC Previous Day After Market Close. it means the earnings were announced after the market closing of the previous trading day
-
Coming Soon.
7. Accounts
7.2. TD Ameritrade setup
Setup the connection with your account on TD Ameritrade. In order to use a TD Ameritrade account from Arcade Trader, TD Ameritrade requires each user to create an app in the TDAmeritrade Developer Portal first.
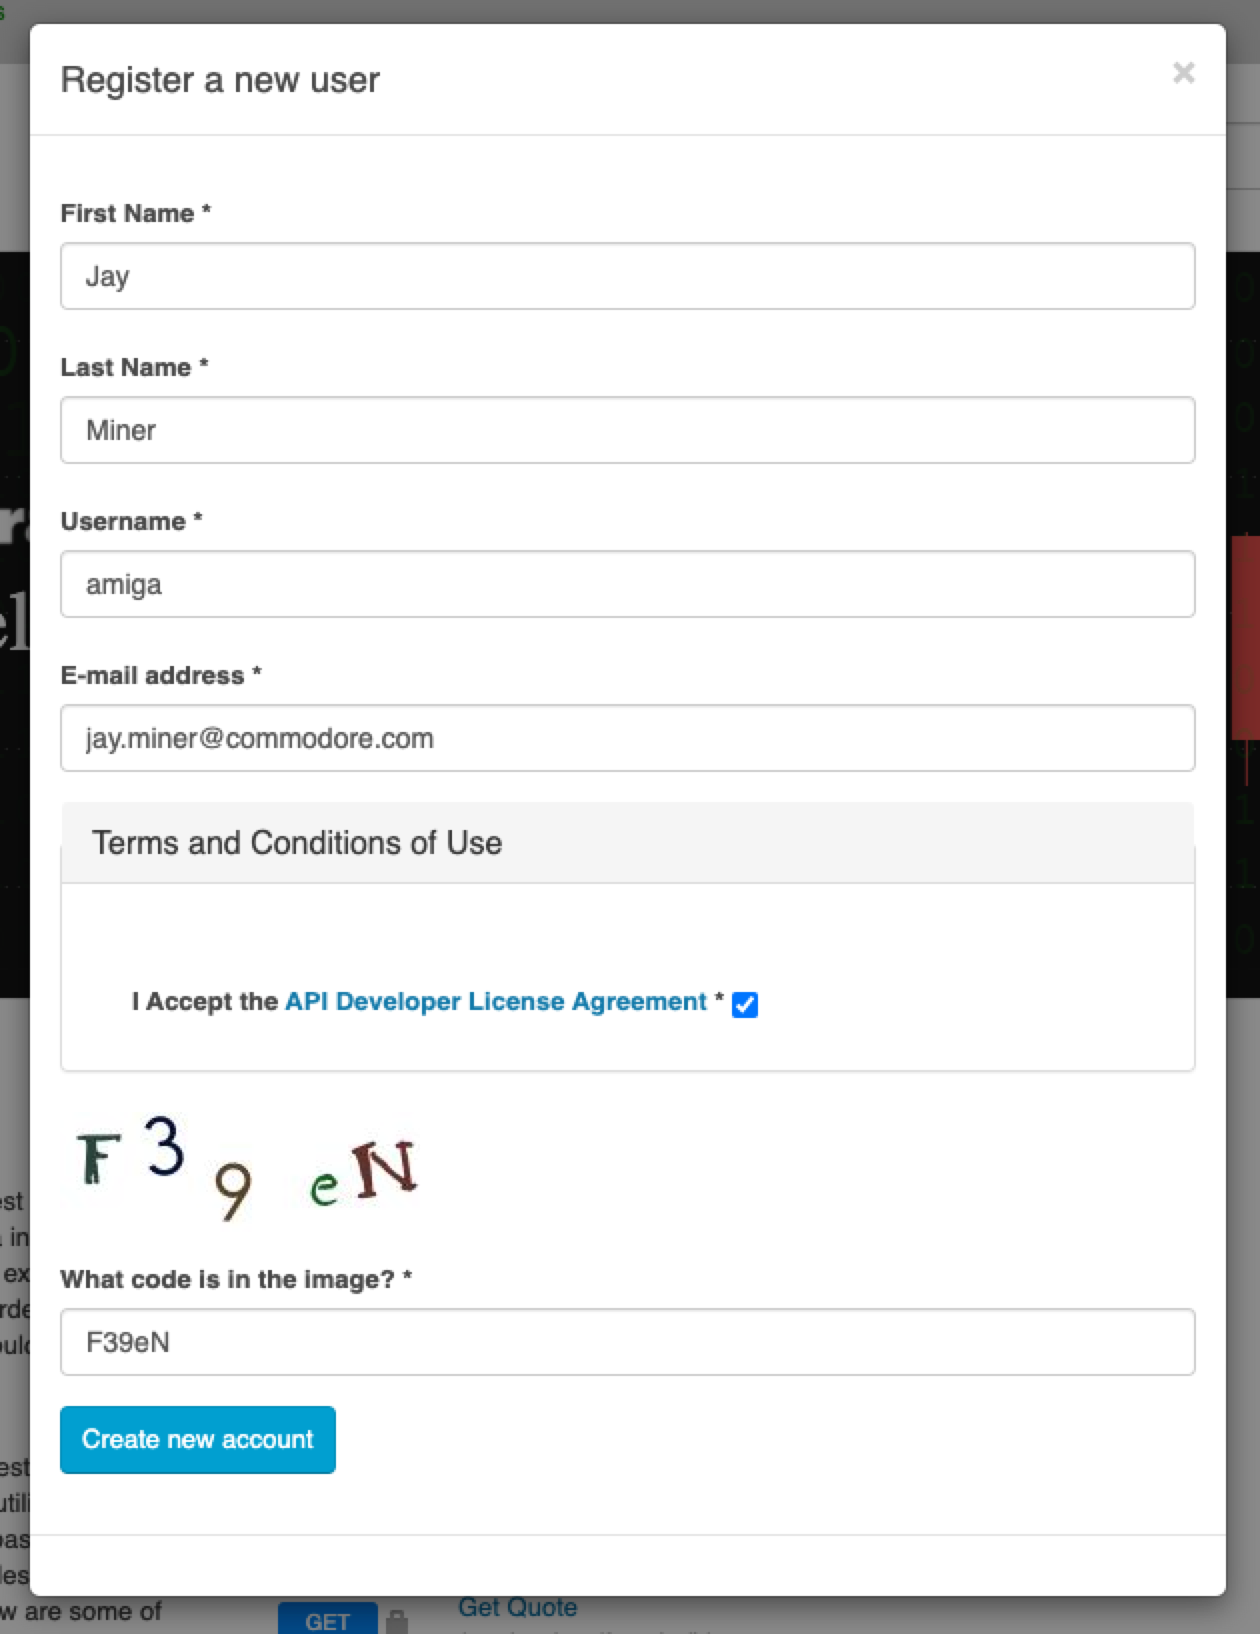
7.3. (1) Create an account in TD Ameritrade Developer Portal
Goto the TDAmeritrade Developer Portal and click on Register, then fill the form about you, read and accept the API Developer License Agreement, insert the captcha and then click Create new account.
7.4. (2) Create an App
Click on My Apps top menu to access to the page of the applications can interact with yout account.
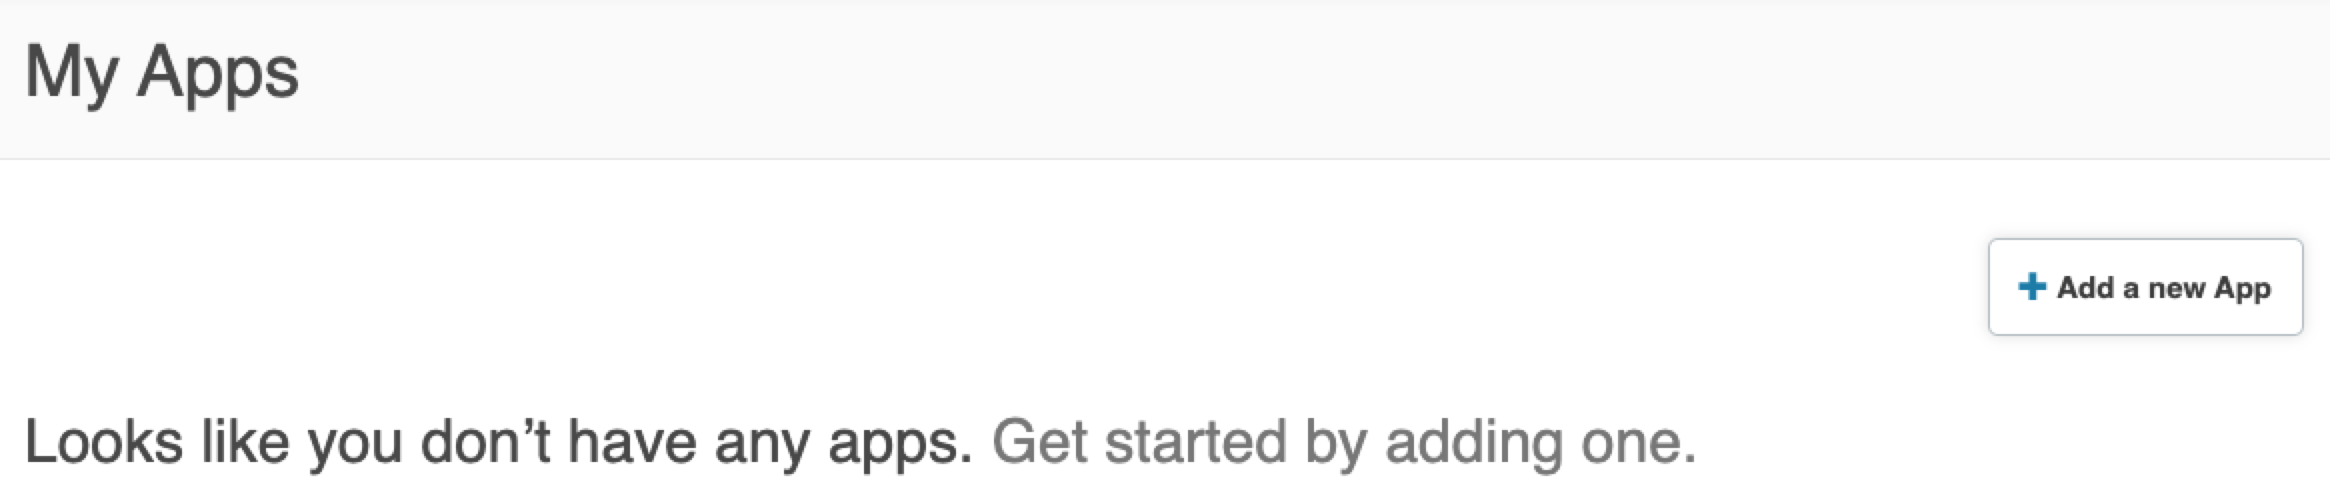
There are no apps configured by default, it’s time to create a new one for Arcade Trader.
Click on + Add a new App.
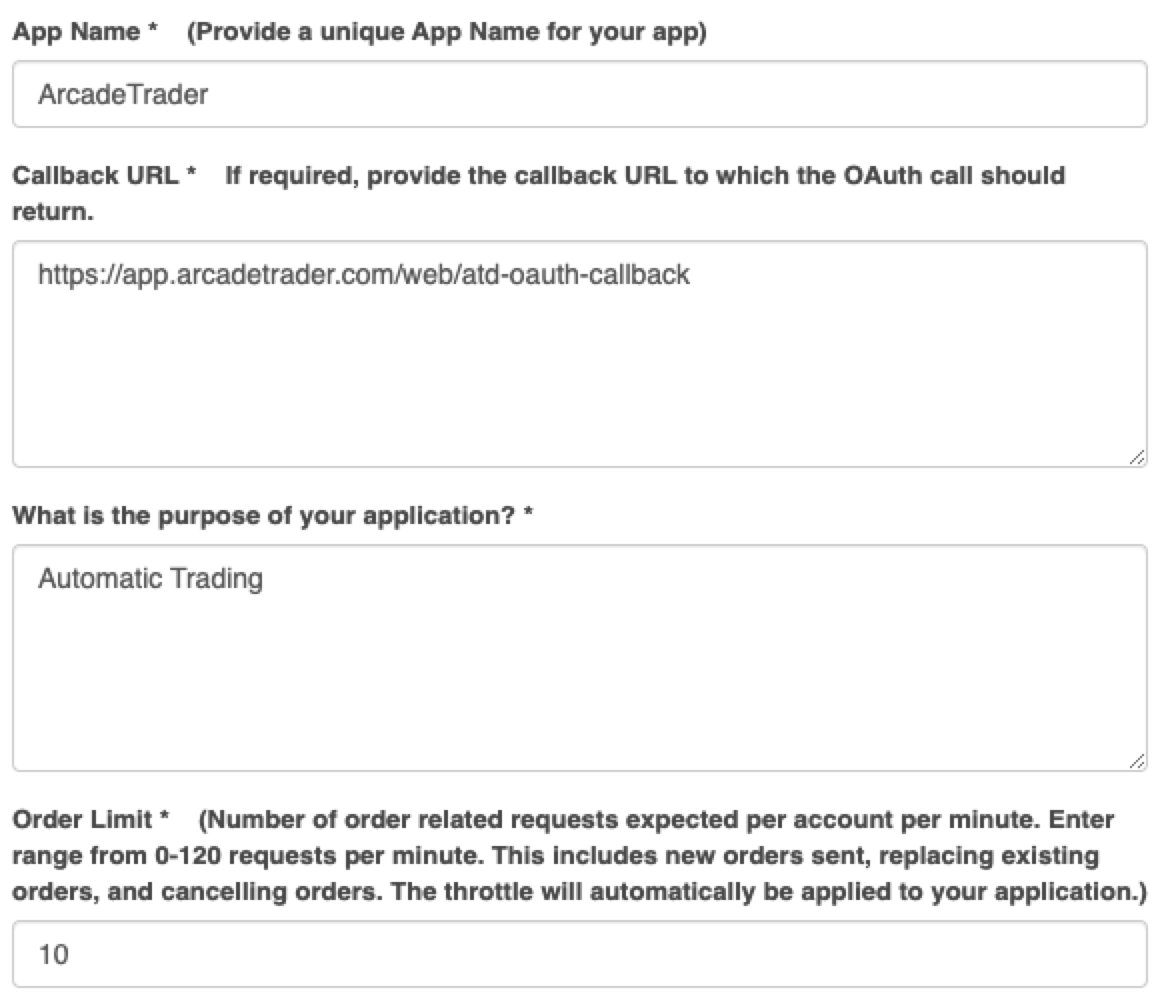
7.5. (3) Setup the App
A new popup will show up. The most important fields are:
-
The
Callback URLthat must behttps://app.arcadetrader.com/web/atd-oauth-callbackand -
The
Order Limit.Set this to 10 req/minute.
You can fill up other fields with whatever you like. Look at this example.
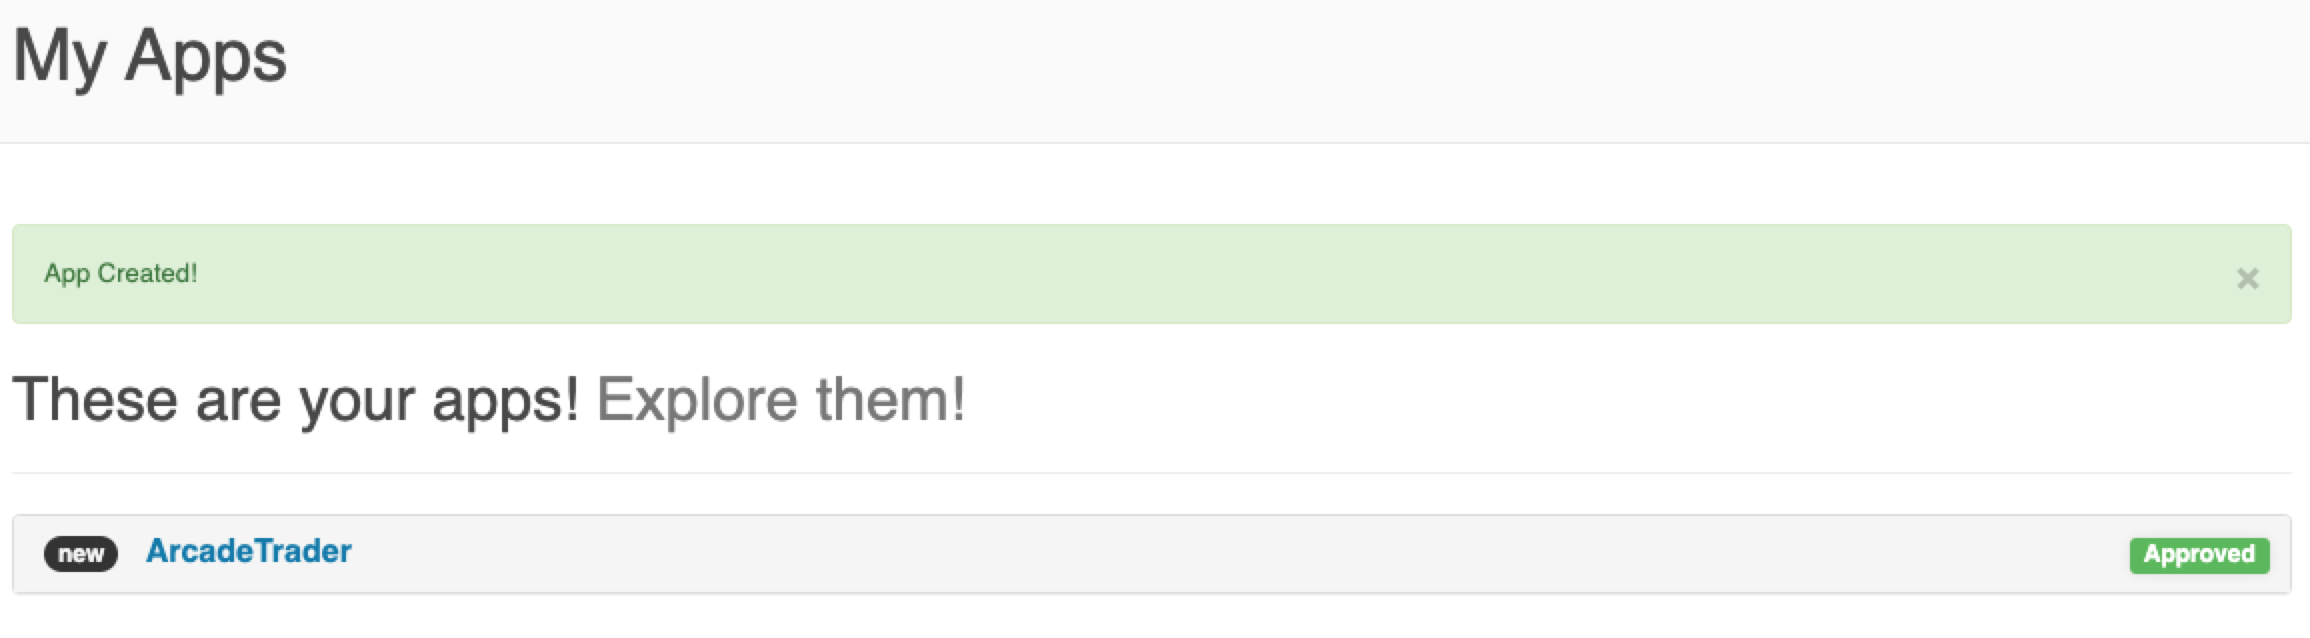
Then click on Create App and you should see your new app enlisted in "My Apps" page.
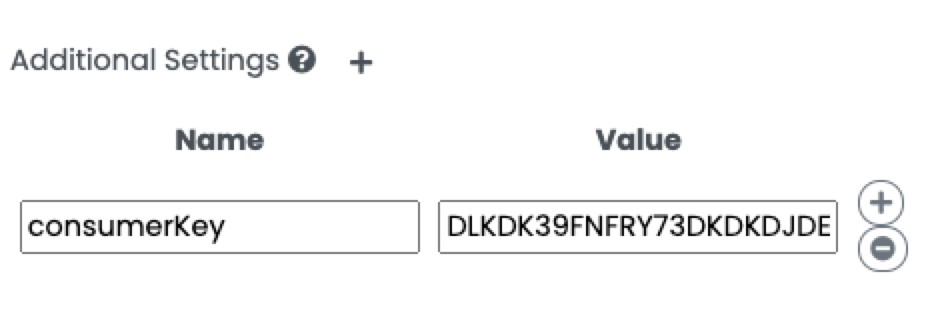
7.6. (4) Get the Consumer Key
Now click on the new app you just created and copy the Consumer Key value somewhere. Arcade Trader will need this key to work with your account.
7.7. (5) Setup the account in Arcade Trader
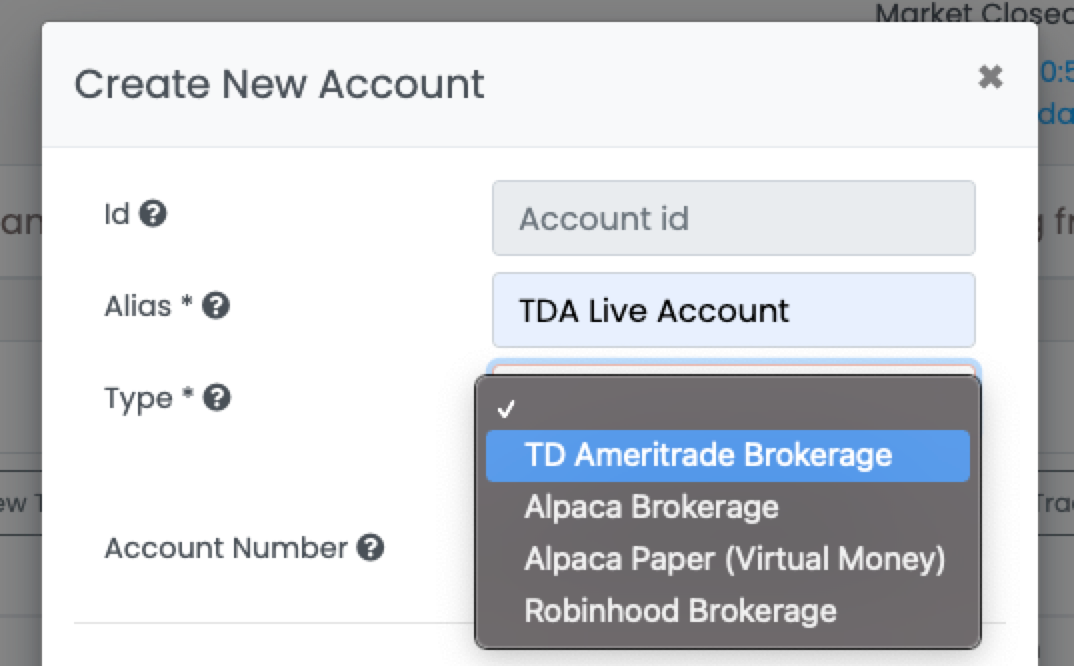
Login in Arcade Trader and click on Add a New Account button from the Accounts widget in the home page, or from the Trading Accounts page.
Now insert the name for the account, like "TDA Live Account" in this example, then select "TD Ameritrade Brokerage" for the Type of account.
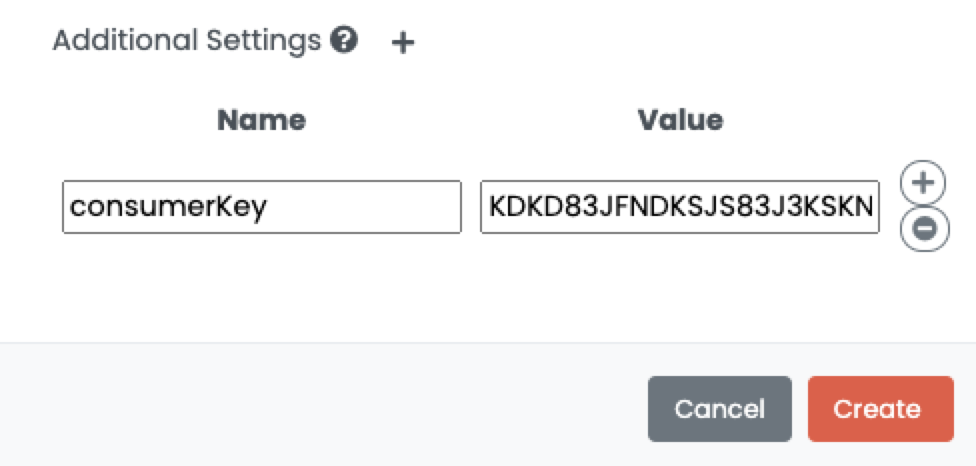
Insert the Consumer Key you have saved on step (4) in the Additional Settings section, under Value.
Now click on Request Authorization button to request the authorization to TD Ameritrade.
7.8. (6) Authorize Arcade Trader from TD Ameritrade
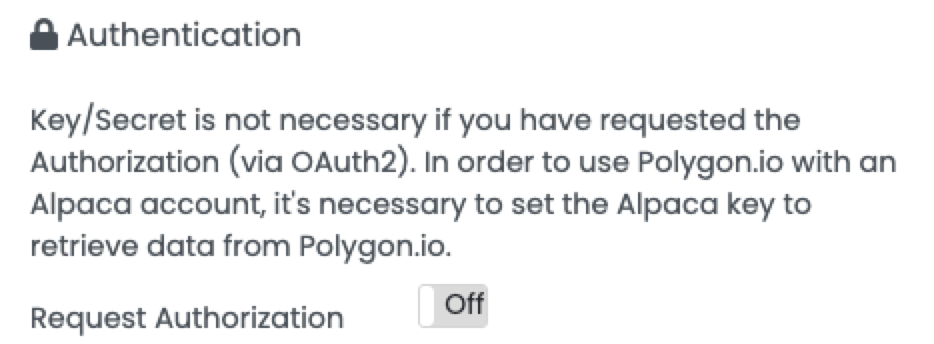
The button will switch from Off to On and a popup will open on the TD Ameritrade website requesting for the authorization.
Click Allow to give the permission to Arcade Trader to interact with your brokerage account.
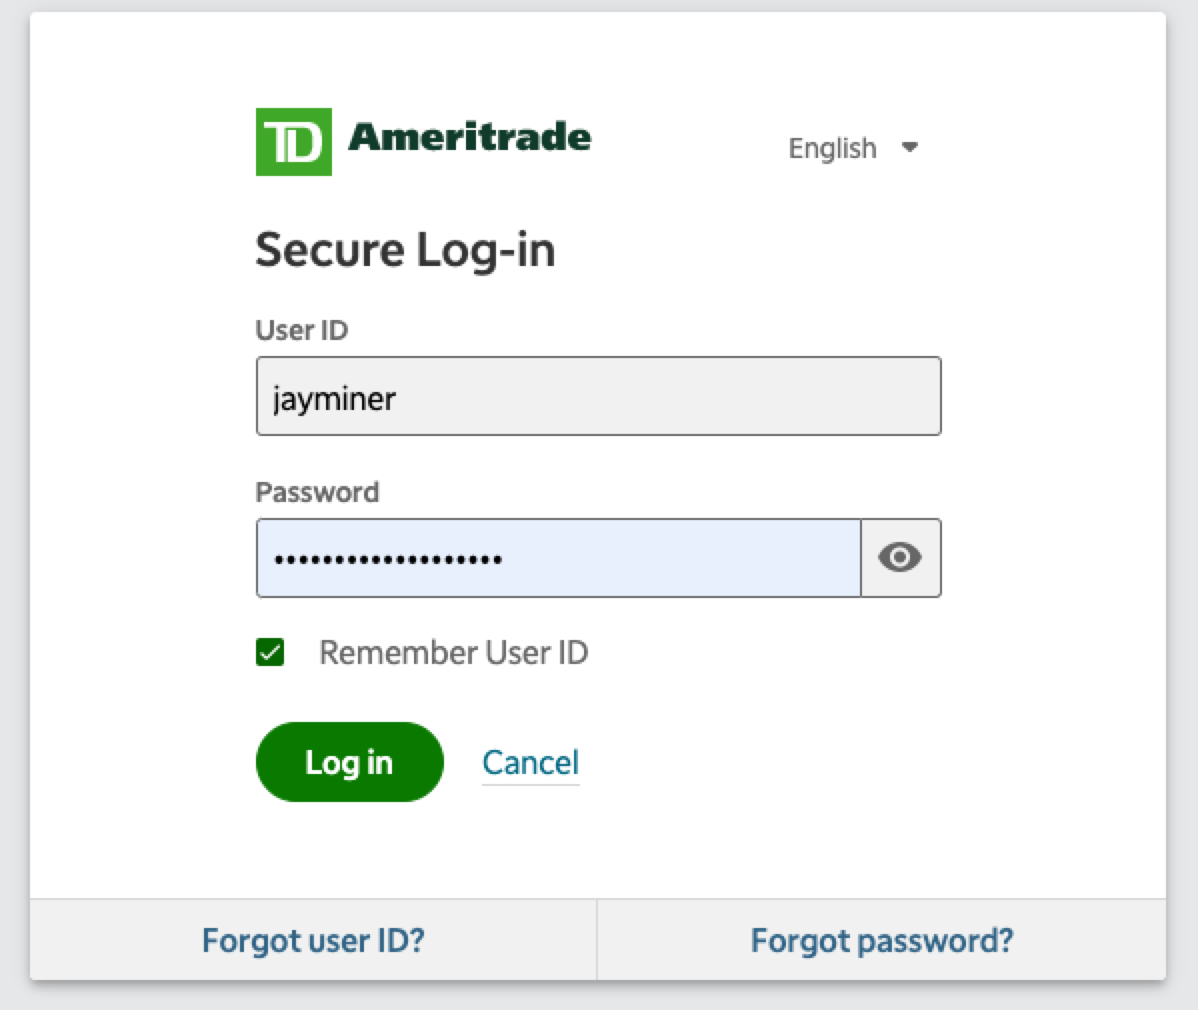
Enter your TD Ameritrade credentials and click Login.
Now please click on Allow button to authorize Arcade Trader accessing to your account.
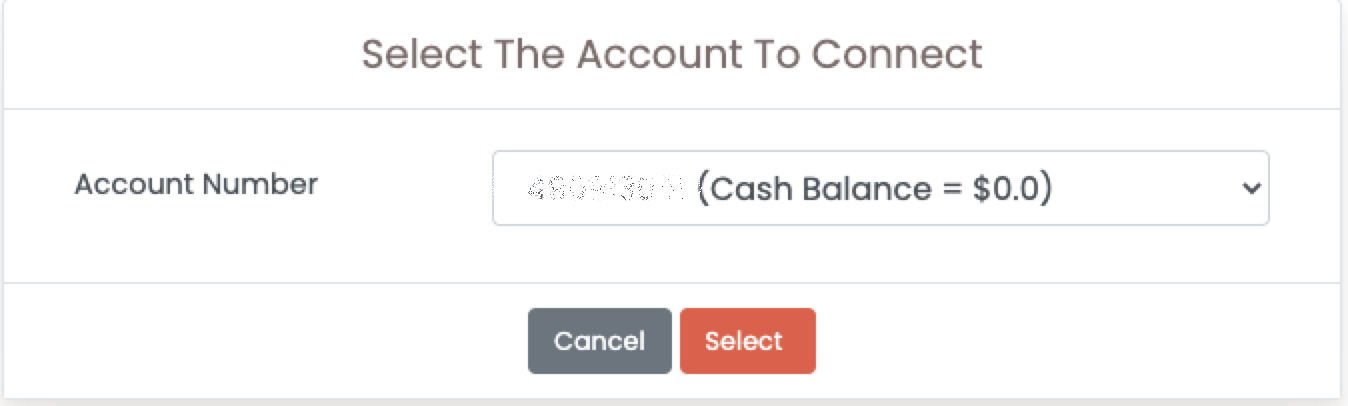
At this point select the TD Ameritrade account you want to use for trading and click on Select.
8. Universes
A universe is a set of symbols. The number of universes and the symbols you can define in it depends on your subscription. Universes are fundamental in strategy definition.
Create a new universe or select the universe to modify by clicking on "Universe Name". To add one or more symbols to the Universe, click on the "Add" button and the following Pop up will be shown.
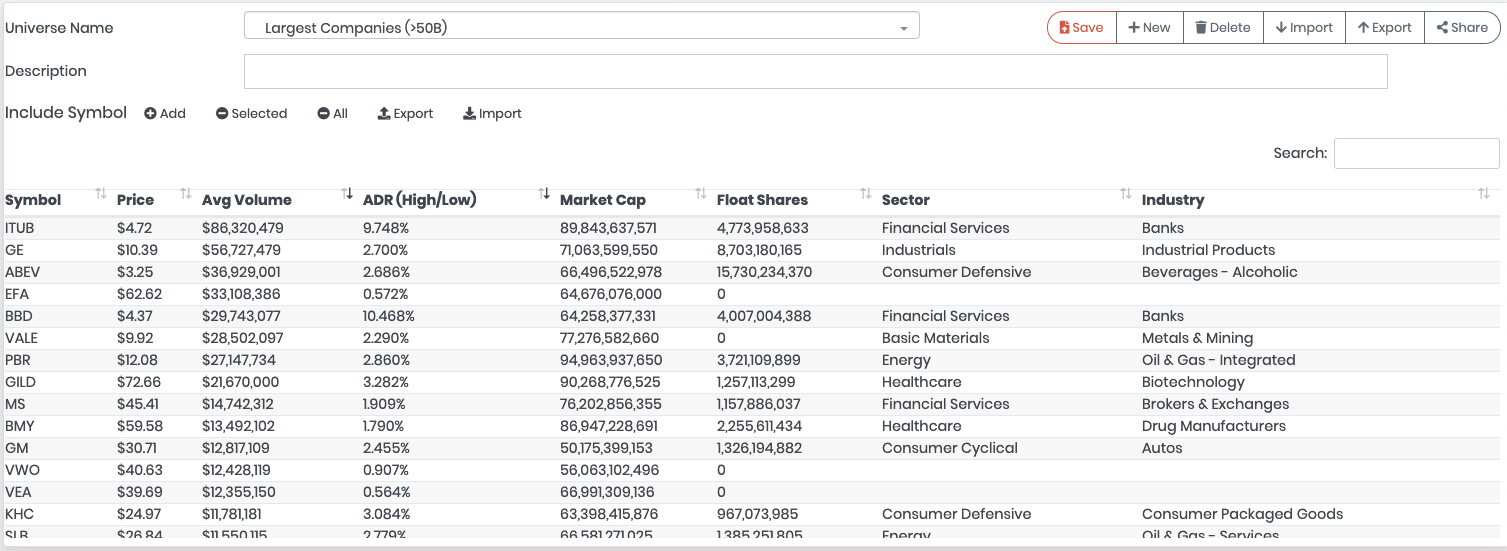
When you save a Universe, the searching filter is saved with the Universe, so when you click on "Add", the previous filters are pre-filled.
8.1. Add Symbols
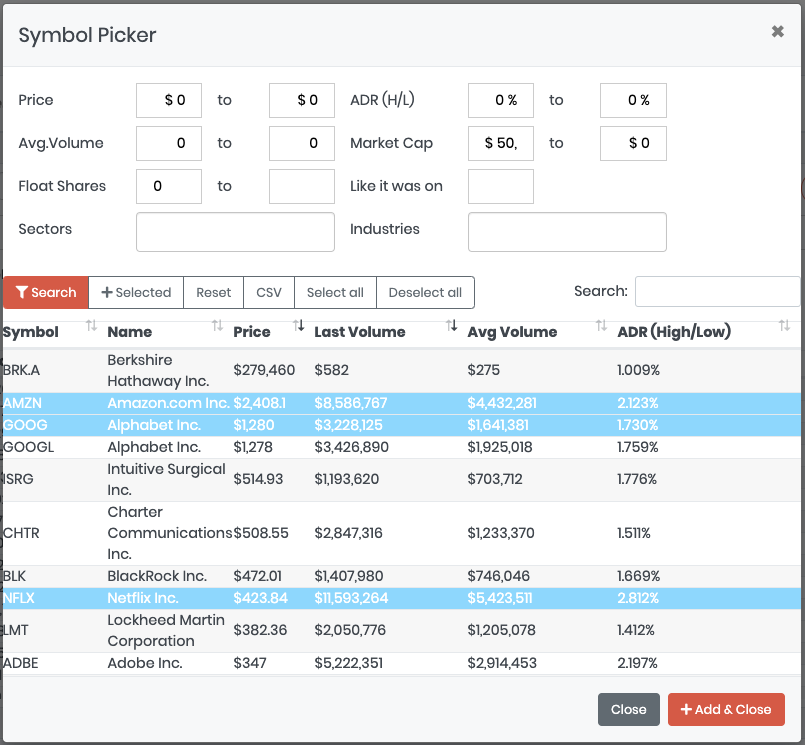
In the Symbol Picker popup you can filter a symbol by:
-
Price Range
-
ADR High/Low Range
-
Average Volume Range
-
Market Cap Range
-
Float Shares Range
-
A specific date for the filters (Arcade keep track of those values back in time)
-
Sectors
-
Industries
Once you have found the symbol to Add, click on "+ Selected" or "+ Add & Close".
When the popup is closed you’ll see the symbols added in the Universe.
| Don’t forget to save the Universe when you’re done. |
9. Live Trading
The Live Trading page is the most used page to watch your robots working for you.
| You can switch between accounts by selecting the account you want to monitor on the top bar. |
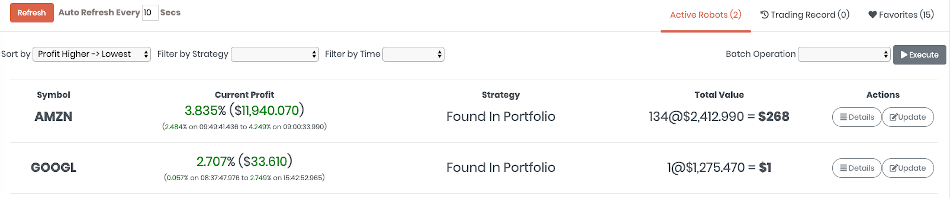
9.3. Robot Traders
In this section you can monitor your robots, change the configuration at run-time, decide to buy more, do a partial sell or close the position and stop the robot.
9.3.1. Update Robot
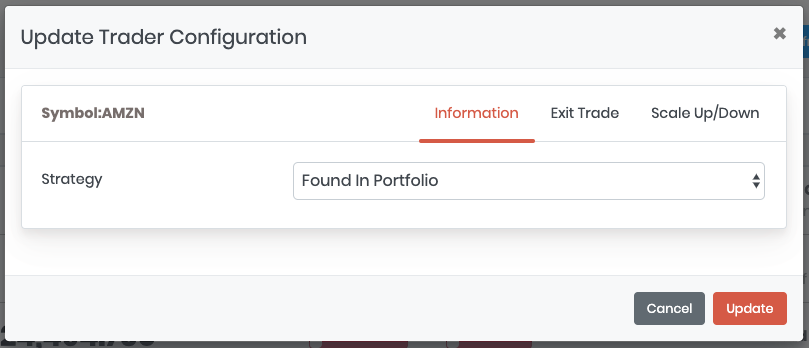
To update a Robot click on the "Update" button and a popup with the configuration will show up.
|
From the Information Tab you can change the strategy used. Selecting a different strategy won’t replace the strategy settings with the new strategy defaults. This means that max profit, stop loss and other settings will remain the same of the original strategy selected. |
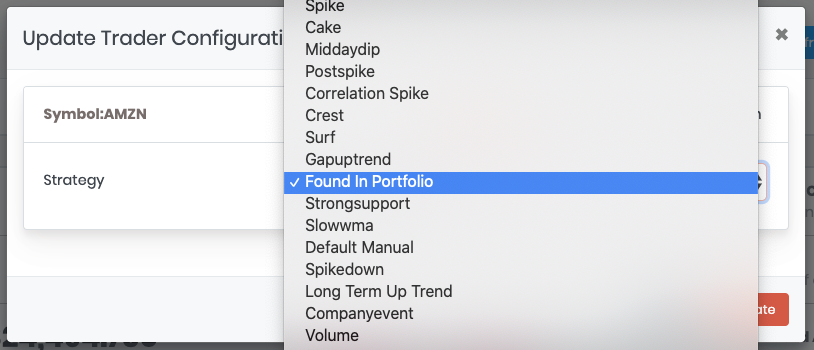
|
You can select any of the Strategies you have developed. |
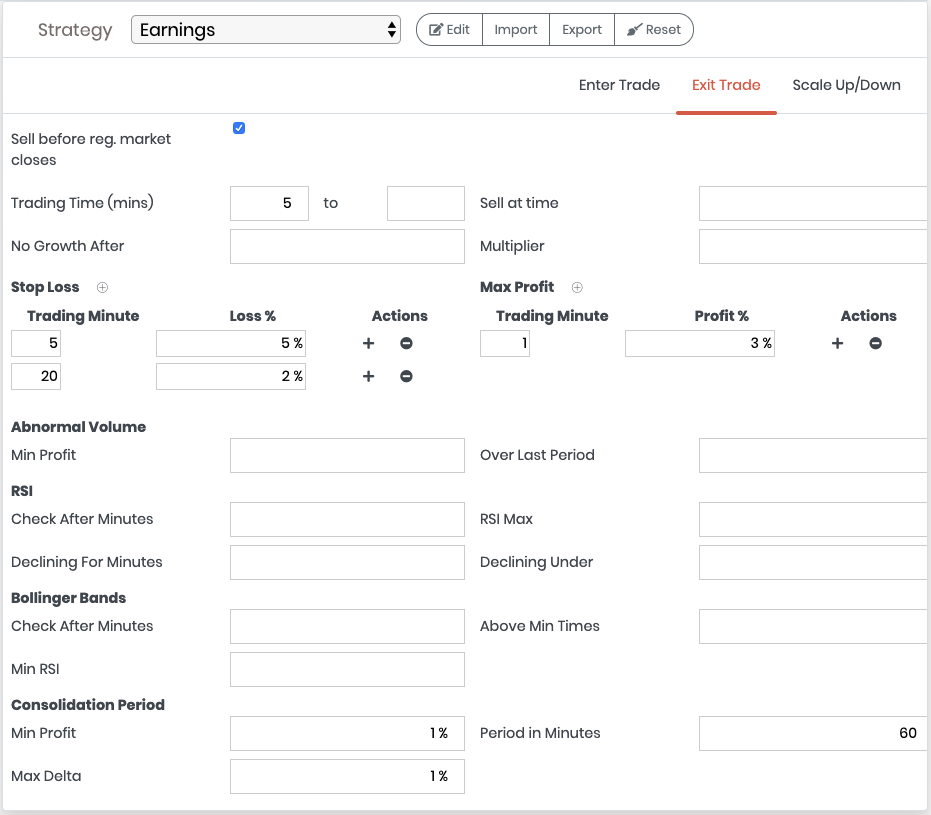
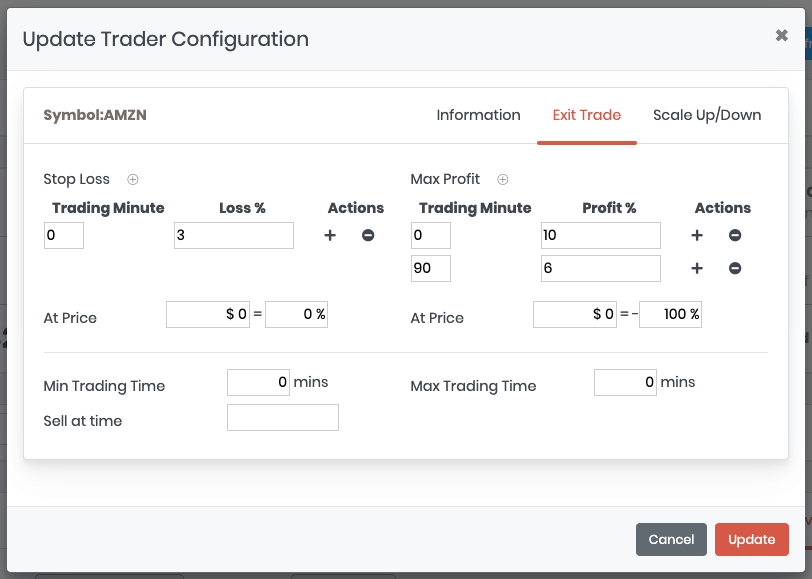
The Exit tab contains the settings to terminate a Robot. Check Strategy Exit to know more about the settings. |
|
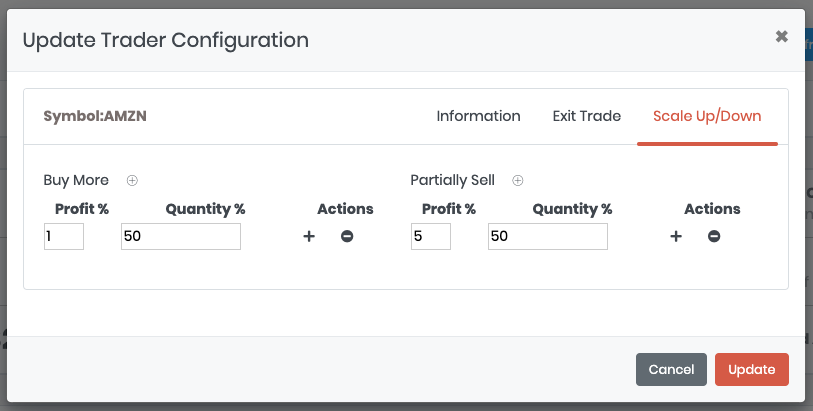
The Scale tab contains the settings to scale up or down a Robot. Check Strategy Scale to know more about the settings. |
|
9.4. Trading Record
It’s crucial to understand how your robot performed. To analyze it post-trading, use the Trading Record. From the Live Trading page, click on Trading Record tab to access to your track record.
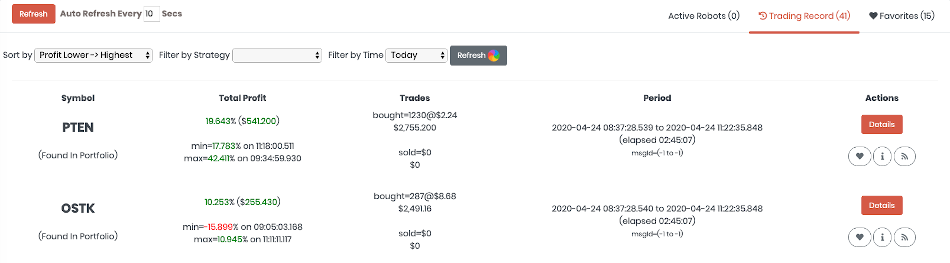
You can change the order of the tradings, filter by strategy and load past trades. Here are contained very usuful information about past trades:
-
Trading period, with the exact time of begin and end of trading in milliseconds. You can click on the date to access to the Market Stream Analyzer to see the messages that caused the begin and the end of tradings.
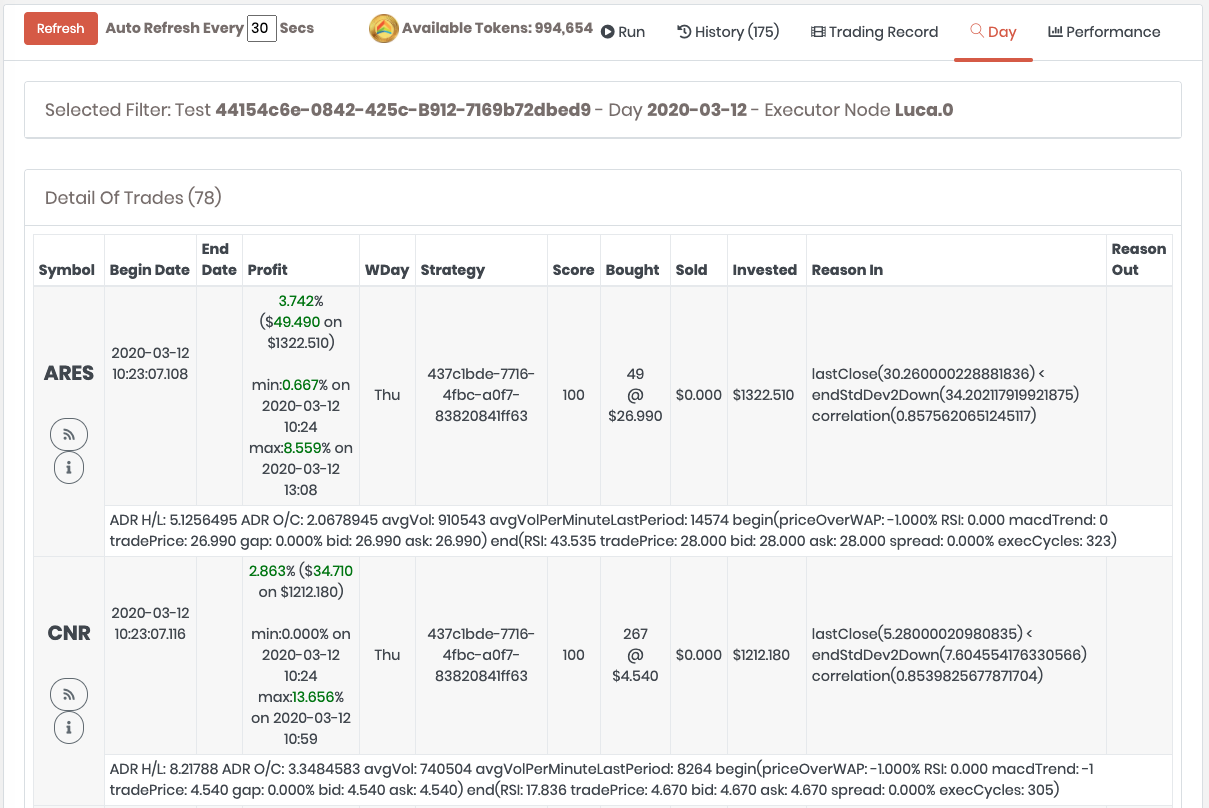
This is a summary of the past tradings. To know more about a trade, click on "Detail" button to display:
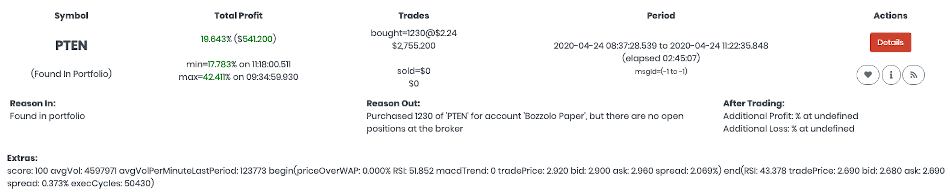
-
Reason In: as the reason why the trade was initiated
-
Reason Out: as the reason why the trade was terminated
-
After Trading: the profit/loss you could have if the trading wasn’t terminated. This is useful to understand if the trade was terminated too soon.
-
Extras: Trading metrics at the beginning and the end of the trading
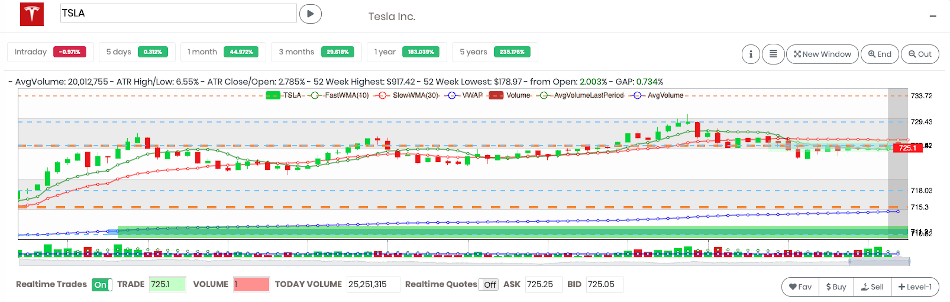
10. CandleStick Widget
The CandleStick Widget is available on every page in Arcade. Everytime you see a symbol, you can click on it and the Candlestick Chart widget will be opened automatically. If the symbol is in a context with a date, like with a trade, the chart will be opened at that point in time. For Orders is the time of the order, for Trades is the begin/end range for the trade, etc.
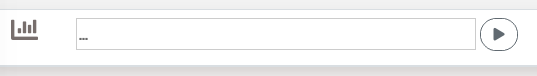
As soon as you start typing, the matching symbols and companies are suggested. Matching with symbols come first, then the matching with company names.
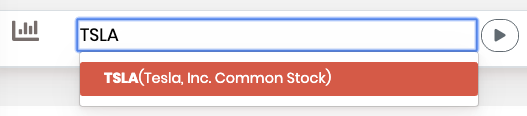
Now click on the ">" button or any of the suggested symbols and your chart will be loaded and the widget automatically expanded.
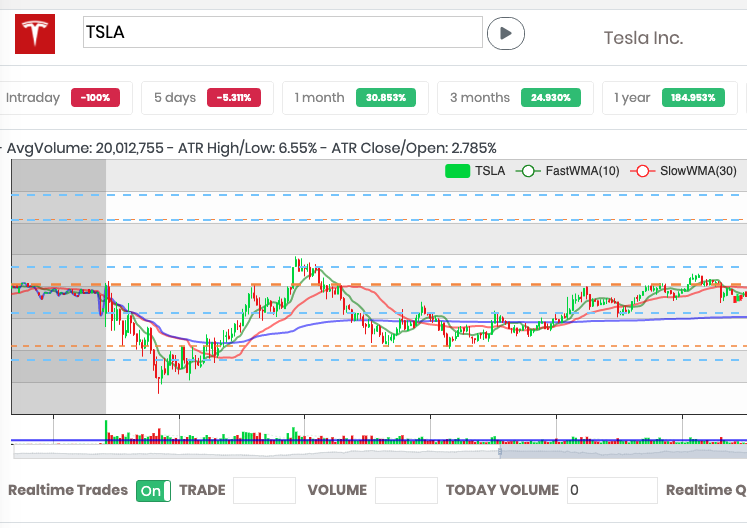
10.1. Time Bar
At the top of the chart you can find the time bar with a summary about the delta of the price against the past. If you click on the period of time, the chart is updated with the selected time as the new range.

10.2. Chart Settings
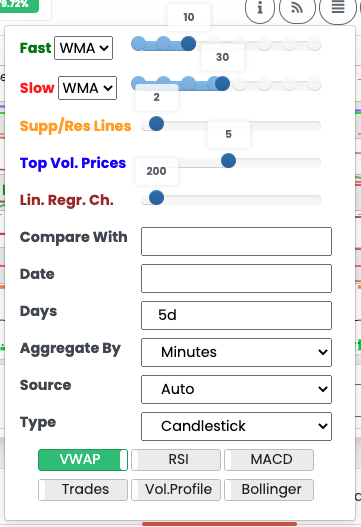
To change how the Candlestick Chart is rendered, click on the "hamburger" button in the chart to open the menu. You can enable the following:
-
Fast *MA: It’s the fast Moving Average line rendered in green. You can pick any of SMA, EMA, and WMA. By default the WMA 10 is selected
-
Slow *MA: It’s the slow Moving Average line rendered in red. You can pick any of SMA, EMA, and WMA. By default the WMA 30 is selected
-
Supp/Res Levels: Minimum strength of Support and Resistance Levels lines. They are rendered as brown dottet lines. The higher the strength, the thicker is the line. Default value is 2.
-
Top Volume Prices: Number of Top Volume Prices to display. They are rendered as blue horizontal lines. Default value is 5.
-
Lin. Regre. Ch.: It is the number of bars to compute the Linear Regression Channel. They are rendered as 5 parallel lines. The central line is black and represents the value, while the upper and lower lines are the 1st Standard Deviations from the value. The second line upper and lower represent the 2nd Standard Deviations from the value. Default value is 200 (previous bars).
-
Compare With: Optional Symbol to compare with
-
Date: to load a specific day
-
Days: the number of days to load back from Date, if any, or the current day if Date is empty. You can specify 5 days with "5d", 5 weeks with "5w" and 5 years with "5y"
-
Aggregate By: pick "Minutes" for intraday charts, "Days" to display weeks, months or years
-
Source: Source of data for the chart. Default is "Auto" that takes the most accurate source for the requested data. But you can force a different source. Check Chart Sources
-
Type: is the type of chart. Default is Candlestick, but other charts are available. Check below the Chart Types section.
-
[RSI]: shows the Relative Strength Index
-
[MACD]: shows the Moving Average Convergence Divergence
-
Trades: shows the number of trades for a minute. This information is not always available
-
[Bollinger]: shows Bollinger Bands
10.3. Chart Sources
Arcade, be default, uses the most accurate source of data in case multiple sources are available. With the chart widget, select the default Source is "Auto", but you can force a different source. Available sources (in order of accuracy) are:
-
Polygon.io if you have a Polygon.io account or a Live account with Alpaca Broker, then this is the most accurate source of data. It supports all the US exchanges
-
Alpaca to use Alpaca Broker API if you have an account with Alpaca Paper or Live. It receives information from 6 brokers
-
TD Ameritrade to use TD Ameritrade Broker API if you have an account with TD Ameritrade. TD Ameritrade historical API are subject to limitation. Check TD Ameritrade documentation to know more.
For example, if you have connected a TD Ameritrade and an Alpaca account with Arcade, by default Alpaca will be used because it’s a more accurate source than TD Ameritrade.
10.4. Chart Types
Candlestick is not the only chart you can display in Arcade.
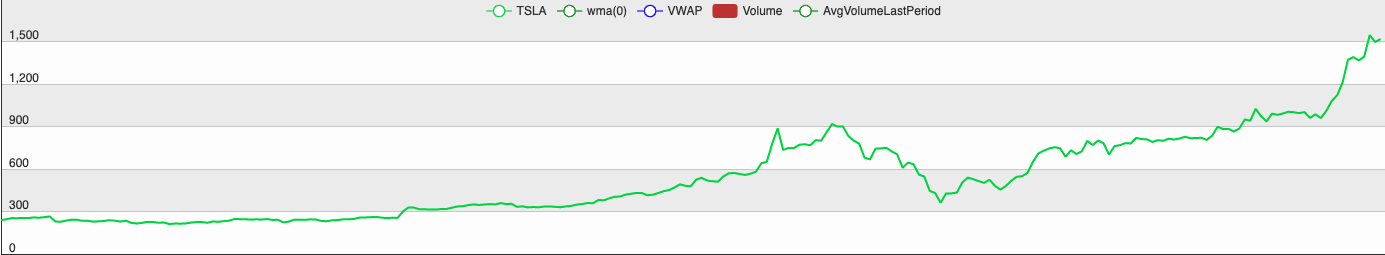
10.4.1. Line
Select "Line (on close price)" as chart type to displays the bars as a line with the value computed on the bar’s close price.
Below you can find the latest 5 years of "T" (Tesla):
10.4.2. Percentage (Proportional)
Select "% Percentage" as chart type to display the values in percentage. This is especially useful when comparing two symbols (check "Compare With").
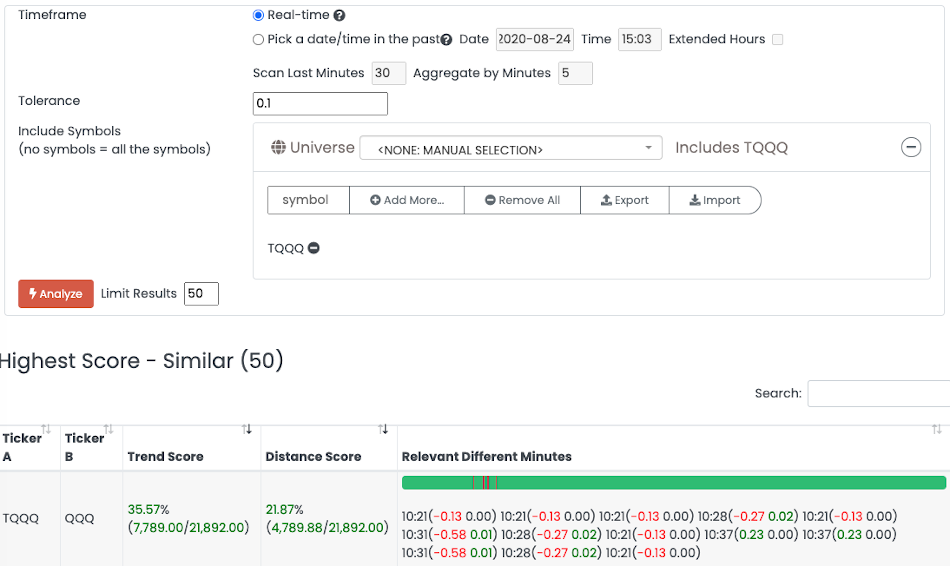
This is a chart of TQQQ (Green) vs QQQ (black). As you can see the chart is the same, but TQQQ (that is a 3X of QQQ) moves much wider in proportion.
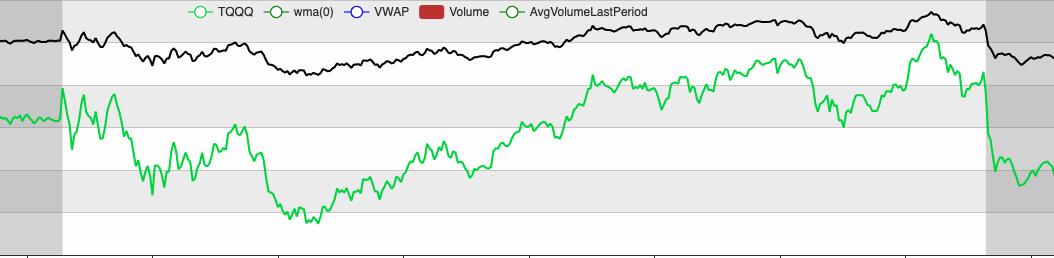
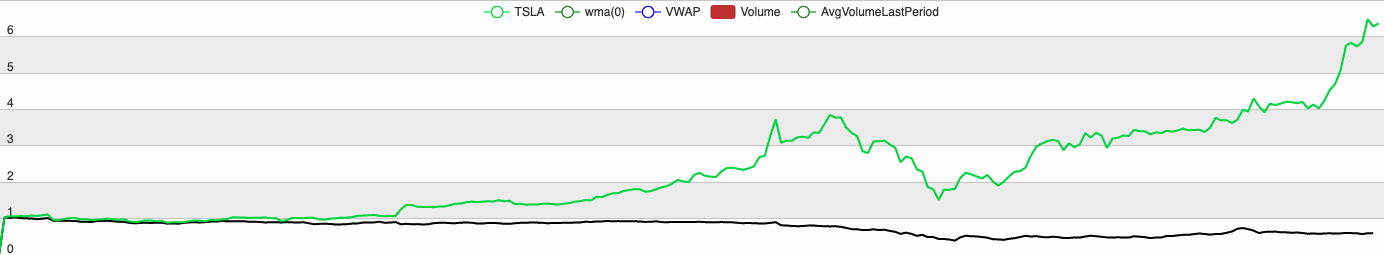
Below you can find TSLA (green) vs F (black). They both start at 1 as initial value, but you can see that in proportion TSLA grew much more than F.
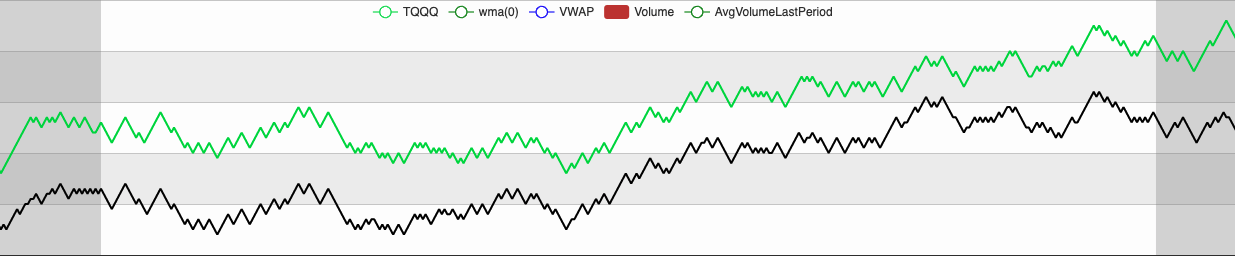
10.4.3. Continuous Trend
Select "Continuous Trend" as chart type to display the trend. If a bar closes higher than the previous one, then the value is incremented of +1, otherwise -1. In case it’s the same, then the value is not modified. This chart type is especially useful when comparing how similar are two symbols.
Below you can find the chart of both TQQQ (green) and QQQ (black). As you can see they are the same, because even if TQQQ is a 3X QQQ, the trend is the same.
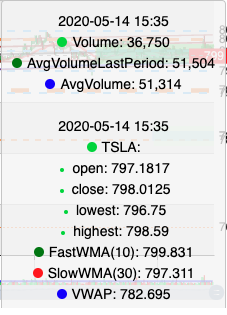
10.5. Information on a Bar
When you click on a candlestick, you can see the information related to the selected bar. If the chart is displaying Intraday bars, then every bar represents 1 minute. Otherwise it’s 1 day. |
|
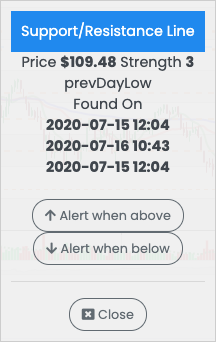
10.6. Support/Resistance Levels
In the chart you can find the Support and Resistance Levels already rendered based on the period displayed. Those lines are drawn in orange color and with t dottet style. The higher is the strength, the ticker is the line. If you click on the line you can see the following details: - Price of the line - Strength is the level of strength as the times the prices was considered a support/resistance line. Minimum strength is 1. - Tags (optional) are the tag associated with the level. Supported tags are: — prevDayClose: for the previous day close price — prevDayHigh: for the previous day high price — prevDayLow: for the previous day low price — todayOpen: for the open price of the current day - Found On all the minutes when the stock used this level as support or resistance - Alert when above create an alert for when the price is above this level - Alert when below create an alert for when the price is below this level |
|
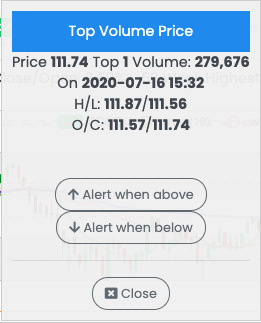
10.7. Top Volume Prices of the Day
In the charts, the top volume prices are represented by a dotted blue line. Those lines are where most of the volume of the day happened. This is a useful indicator to understand what prices can act as support/resistance for the future. By clicking on the line you can access to the details for the top volume price: - Price of the line - Top X Volume: where X is the ranking from - On: the minute when the top volume price has been registered - H/L: High/Low of the bar that had the top volume price - O/C: Open/Close of the bar that had the top volume price - Alert when above create an alert for when the price is above this line - Alert when below create an alert for when the price is below this line |
|
For all the alerts you can setup from the Candlestick chart menus, a new popup with the pre-filled alert will be shown. You can change the settings or just press "Create".
The alert uses the Natural Language syntax. By default, the alert is removed as soon as the first match is found and the notification sent to the user.
10.8. Level1
Level1 contains the information about the real-time trades and the most updated ask/bid quote from exchanges. Arcade doesn’t support Level2 that contains additional information such as the additional quotes from the broker.
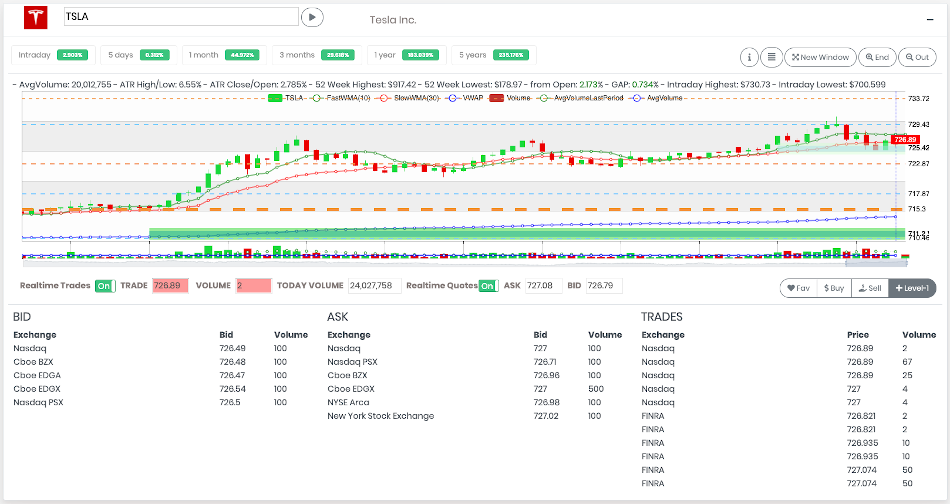
Enabling Level1 data allow to see in real-time what’s going for a stock. When a price increases, it flashes in green, otherwise in red. There are 3 panels:
| Enabling Level1 increases of 10X the number of messages received in the browser. For slow connections it could cause a slow down of the entire Arcade application. |
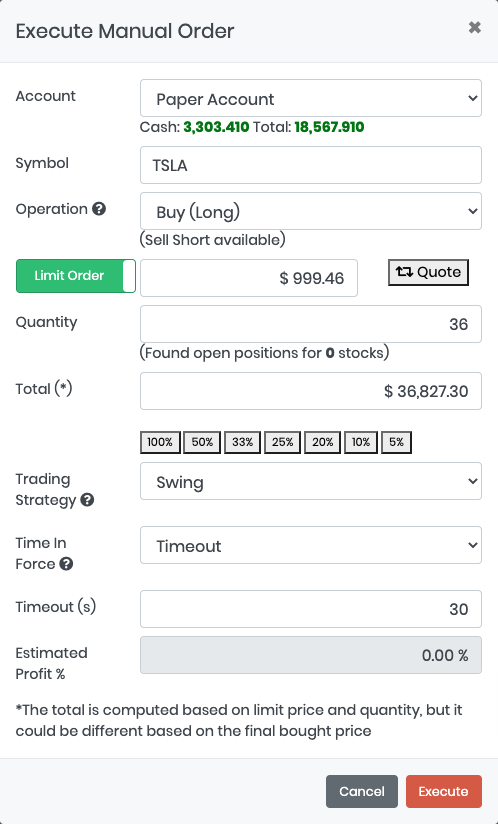
10.9. Manual Order
|
Even if Arcade is a platform for Robots, you can manually buy and sell stocks, both long and short directions. - Account: The account used to buy stocks - Symbol: This is auto-filled by the Candlestick chart, but you can always type something different - Operation Type: This is auto-filled based on the open positions found in the selected account. You can: — Buy Long: Buy stocks (Long Position) — Sell Long: Sell stocks previously purchased (Long Position) — Sell Short: Sell Short borrows a security and sells it on the open market, planning to buy it back with 'Buy To Cover' order (Short Position) — Buy To Cover: Buy back a position sold short (Short Position) - Order Type: By default is Limit Order. By clicking on it you can execute a Market Order instead - Quantity: The number of stocks to buy. - Total: The total amount as the multiplication of Price and Quantity. This is automatically calculated when you modify the price or the quantity. If you modify the Total amount, then the quantity is modified according to reach the total amount. - Quick % Buttons: By clicking on these buttons, the total amount will be calculated based on the percentage of the remaining cash. For example, clicking on the 50% button, the total will be 50% of the remaining cash. - Trading Strategy: Pick your strategy here. Even if the trade has been started manually by you, a new Robot will be created to follow the trade. The available trading strategies in the Manual Buy popup are defined in Investment Profile. - Time In Force: By default the order is sent and canceled after the timeout expires. Timeout orders work also during Extended Trading Hours. - Timeout: By default 30 seconds and is enabled only if the selected [TimeInForce] is "Timeout" When you press the button "Execute" the order is sent to the broker. If the order is filled or not a notification message will be shown to the user. |
11. Strategies
11.1. Strategy Workflow
Arcade Trader receives real-time data from multiple data providers by using Web Sockets. Based on your account type the events arrive from Polygon, Alpaca and TD Ameritrade. In all of these cases, the messages from the data providers are under the form of Ticks (Quote and Trade ticks).
Arcade Trader aggregates all the incoming tick messages in memory and every minute generates an artificial "Aggregated Minute" message that follows the same path of the tick messages from the data providers. Most of the strategies don’t need a tick level reaction, so using MINUTE as Data Level allows to call user functions every minute with the last aggregated minute as bar.
So, there are 3 type of messages can be dispatched to start or end a trade:
-
Quote Tick message, containing the most recent quote from an exchange as ask price and size, bid price and size, and conditions.
-
Trade Tick message, containing the executed trade as price, volume and conditions
-
Aggregated Minute Bar, an artificial message created by Arcade every minute containing the minute aggregation for a symbol
| Quote and Trade Conditions are not available with all the data providers and with compressed test data |
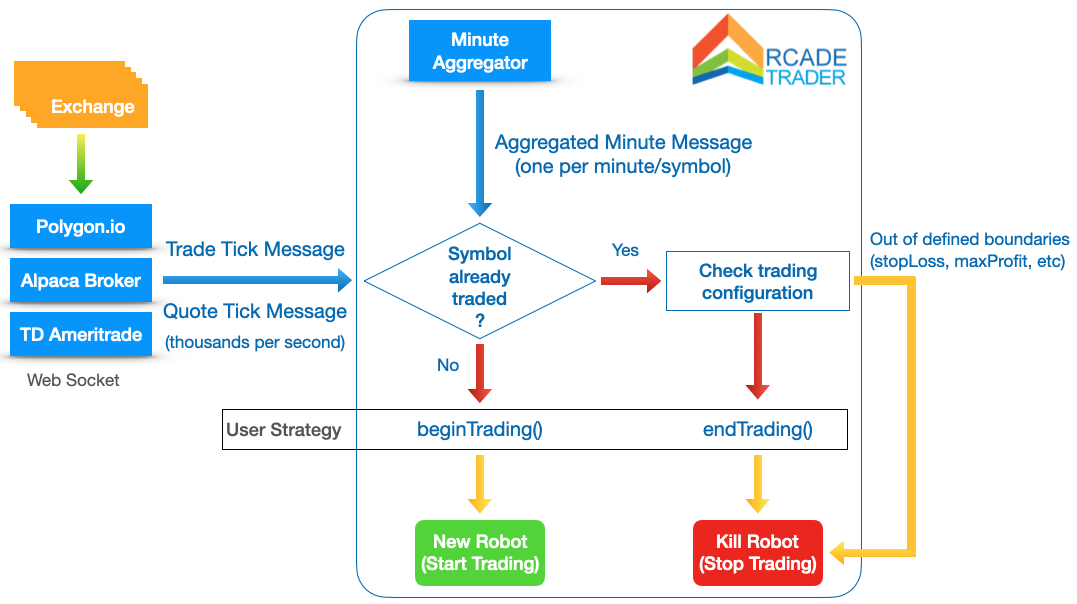
Messages are relative to one symbol only.
For each message, Arcade checks if in your account the symbols is already traded (there is an open position on that).
In case there are not open positions, the user’s beginTrading() function is called (see below in Getting Started with Strategies about beginTrading function).
The user function decides if start a new trading on the received symbol.
In case there are already open positions for that symbol, Arcade Trader first checks if the trading should end by configuration (if any boundaries have been reached, like the maximum profit or stop loss) Then, it executes the user’s endTrading() function to let the user decide if the trading must end or not (see below in Getting Started with Strategies about endTrading function).
In Arcade Trader creating a new robot means starting a new trading by opening new positions for the current symbol. Killing a robot means the trading is over and the open positions are all sold.
A new robot can be created automatically by Arcade in the 2 following cases:
-
At startup, for each open position found in the account. In this case the strategy "Found In Portfolio" is used
-
On regular basis Arcade Trader checks the open positions in the account match the positions hold by the robots. If the amount of stocks in the brokerage account differs from the amount in Arcade, then Arcade automatically updates its quantity. This happens when the user manually executes orders manually from outside Arcade.
11.1.1. Example
To understand better Arcade’s workflow, look at the diagram below. In this example you can see how a Trade Tick message start from Nasdaq and ends up on buying stocks in Alpaca.
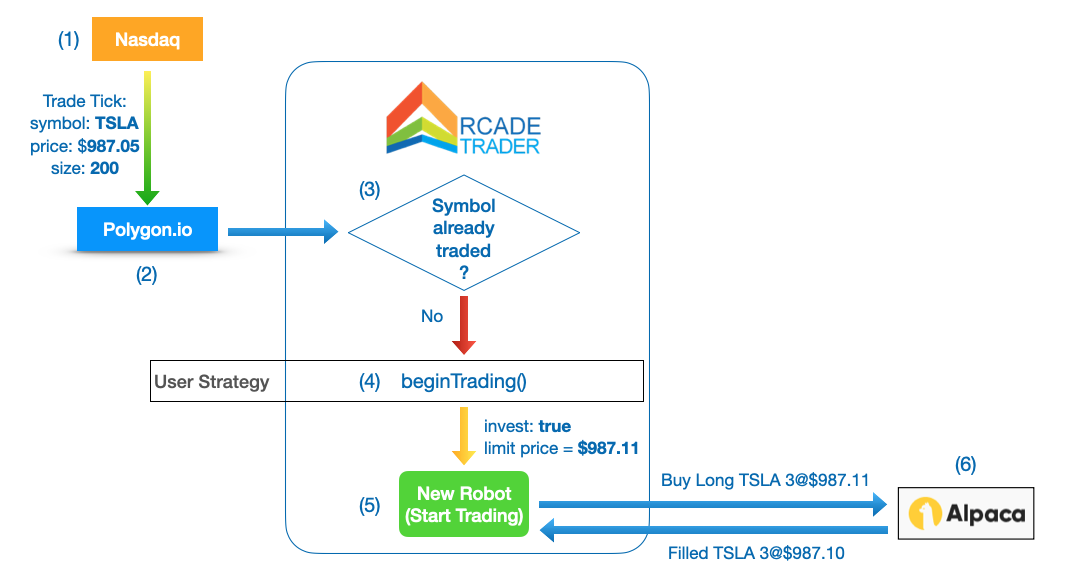
-
Nasdaq emitted a new Trade Tick message relative to Tesla (symbol "TSLA"), with a price of $987.05 and size 200 (amount of shares).
-
Polygon.io routes the message to Arcade connected via Web Socket.
-
Arcade receives the message and check that there are no open position for TSLA, so invoke the user strategy
beginTrading() -
The user strategy decides to start investing by returning the limit price at what the stocks should be bough
-
Arcade computes the amount of stocks to buy (based on the configuration) and send to Alpaca broker a limit order to buy TSLA shares at the price of maximum $987.11
-
Alpaca fills the order for 3 shares at price $987.10
Since the order is filled, the robot is alive and monitors our trade.
For every new message relative to TSLA, Arcade will check the boundaries set in configuration (stop loss, max profit, etc.) and will invoke the user strategy endTrading() to delegate to the user if the trade must end.
11.2. Strategy Development
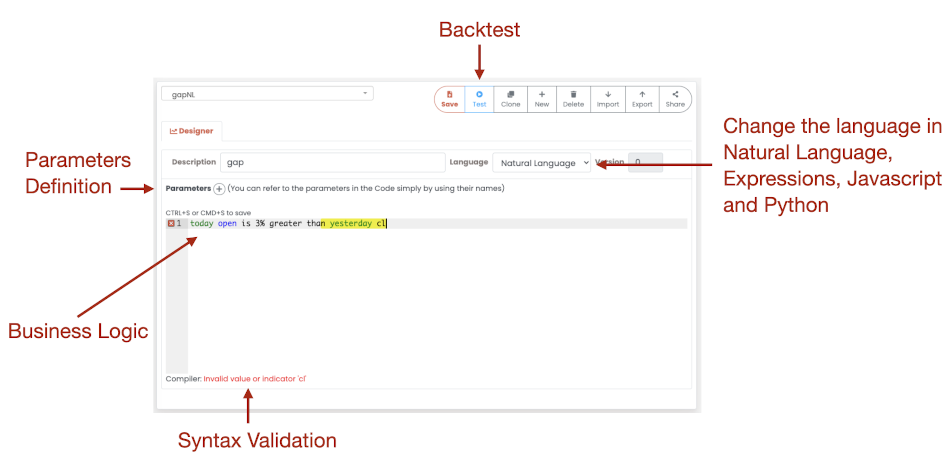
11.2.1. Natural Language
Arcade Natural Language is the new way to write algorithms without any programming skill. It’s easy as writing sentences. By selecting the Natural Language in the Strategy Editor, you will see two main areas:
-
Begin Trading When, containing the condition that if true start investing
-
End Trading When, containing the condition that if true stop investing
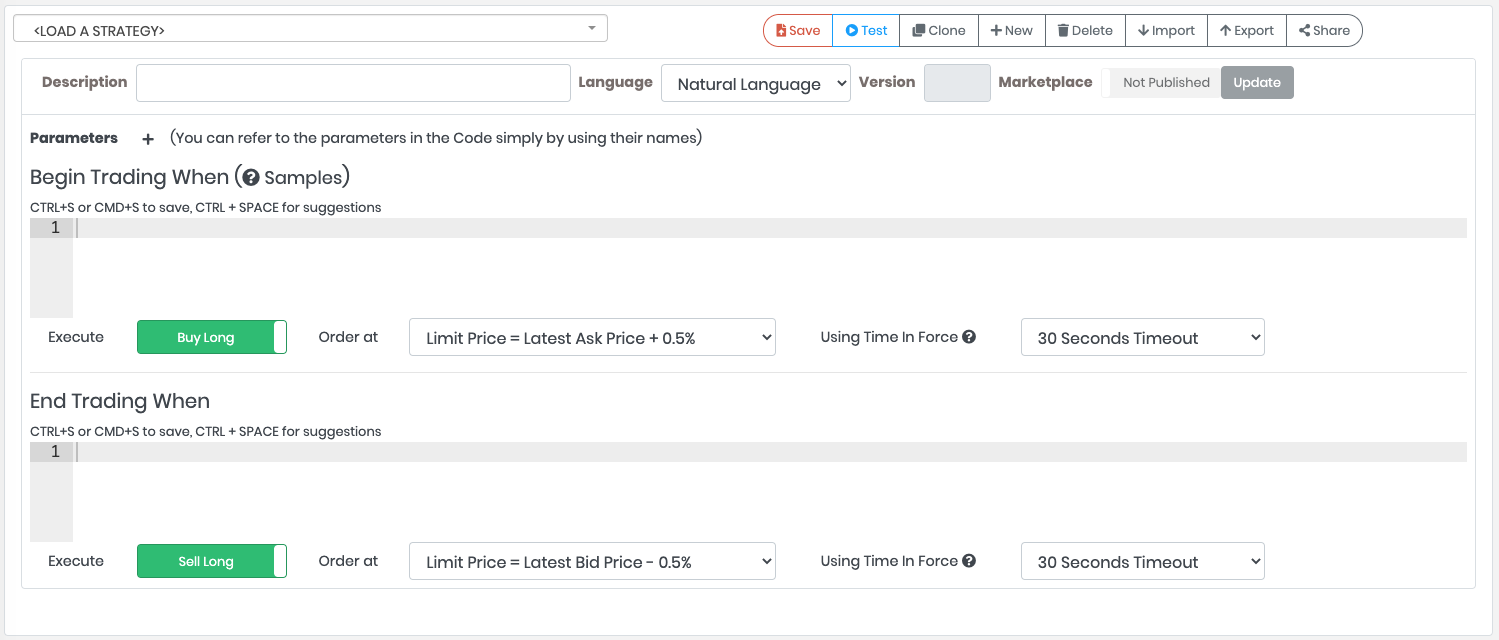
The Natural Language has been built for users with no programming skills or for not complex algorithms. The syntax is the following:
<context1> <indicator1> <operator> [<context2>] <indicator2|value> [<logic operator>]
Some examples:
-
real-time trade price is 1% above last minute close -
last minute close is above upper bollinger band -
last day 150 sma crosses above 200 sma -
last day 150 sma crosses below 200 sma and last minute close is 0.3% below 2 minutes ago close -
trade profit < -3% or trade profit > 3%(this only for End Trading section)
Check out the Natural Language Reference to know more about the what is supported. To see a tutorial about how to write your first algorithm, check My First Strategy Tutorial - Part 1.
With both Start and End of Trading, you can define the order executed in case the condition is true:
Order Type In Begin Trading: Buy Long or Sell Short |
_ In End Trading: Sell Long or Buy To Cover |
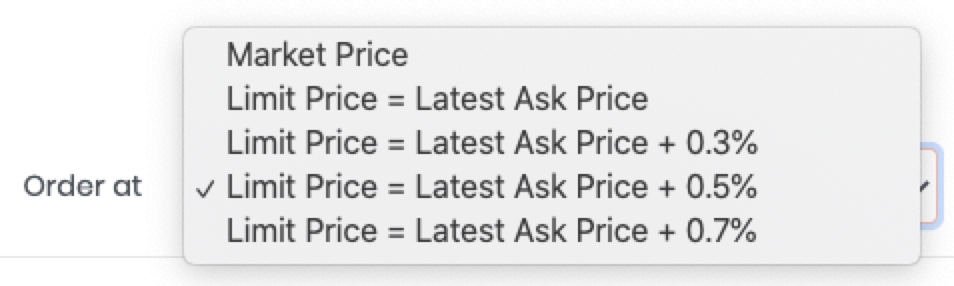
Order Price Market Price or Limit Price with a defined delta in % from the ask/bid price. By default a Limit Price at the latest Ask Price + 0.5% is used. This means the order will be a limit order with a price 0.5% above the latest ask price. |
|
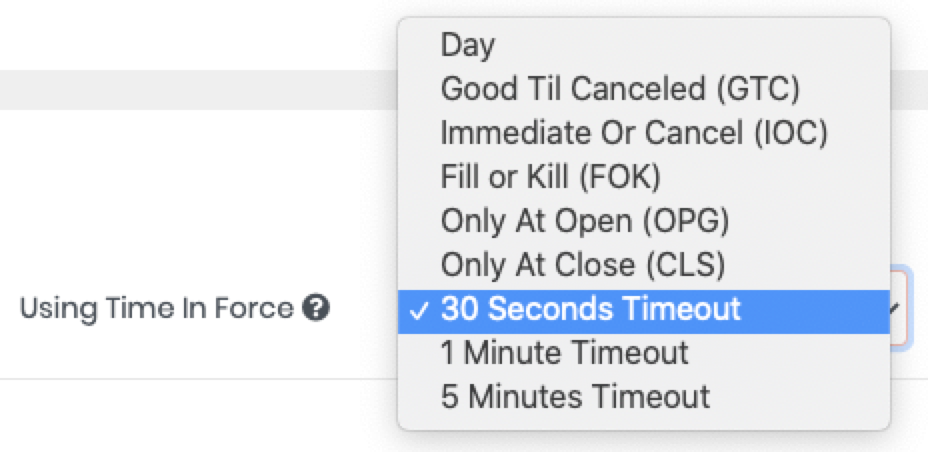
Order Time In Force This is the order type sent to the broker (check the order types your broker supports). With a Timeout order (the default), a Day order is sent, but if it is not partially or totally filled after the timeout in seconds, the order is canceled. Timeout of 30 seconds, 1 minute or 5 minutes |
|
11.2.2. Use a Programming Language
In order to develop a strategy in Arcade, a basic knowledge of Javascript or Python is requested. Usually a strategy is made of IF-THEN-ELSE conditions. In this chapter we’re going to use Javascript because it’s the most popular language in the world and its syntax is very simple and intuitive. If you don’t know Javascript you can take this quick course to get the basics of the language W3Schools Javascript Free Course.
11.2.3. Execution Time
Arcade compiles both Javascript and Python strategies into low-level machine code for the maximum of performance. Usually a strategy is executed in less than 1 millisecond. If you’re using Arcade Enterprise (On-Premise) there are no limits with the execution time. Instead, if you’re using the Cloud version, the maximum execution time for a strategy is based on your subscription plan. Check your plan in Cloud Plans.
11.2.4. Getting Started with Strategies
When we create a new strategy from scratch, this is the content of the code area:
  1
2
3
4
5
6
7
8
9
10
11
12
13
14
15
16
17
18
19
20
21
22
23
24
25
26
27
28
29
30
31

  // Decide if start a new trade or not. It is invoked at every registered message (minute, trade, quote).
// Return null to skip the trading without any log on the reasoning output, or an object
// with the following properties:
// - invest: True = Buy and start trading, False = Do not start a trading (mandatory)
// - symbol: the symbol to buy (optional, if null is the current symbol)
// - qty: number of shares to buy long or sell short. If zero or not specified, the quantity is computed from the strategy configuration
// - goLong: if true means buy long, otherwise sell short (optional, default is buy long)
// - reason: Is the text that explaining the reason why you are starting the trading (mandatory)
// - score: confidence from 0 to 100. 0 means skip buy, 100 means buy the full configured amount (optional, default is 100)
// - limitPrice: buy limit price (optional, by default is the latest ask price + 0.5%)
// - timeInForce: day, timeout (optional, default is timeout 30 seconds)
// Example:
// return { invest: true, reason: "I like this stock so much!" }

function beginTrading(context){
  return null;
}
// Decide to stop an existing trade. It is invoked at every registered message (minute, trade, quote).
// Return null to continue the trading, or an object with the following properties:
// - reason: Is the text that explaining the reason why you ending an existing trading
// - limitPrice: sell limit price (optional, by default is the latest bid price - 0.5%)
// - buySymbol: name of the symbol to buy. Specify this only if you want to end the current trade and start a new one immediately (optional)
// - buyQty: number of shares to buy (optional)
// - buyLimitPrice: if specified, buy with a limit price (optional)
// - buyReason: reason why to buy this symbol (optional)
// Example:
// return { reason: "Max profit reached" }

function endTrading(context){
  return null;
}
Arcade cut all the complexity of algo trading by providing a platform where everything is integrated, and the users only need to write 2 functions:
-
beginTrading(): decides if to begin a new trade by creating a new robot
-
endTrading(): decides if a robot must be halted. This function is optional. If not present, the trading can be terminated manually or by one of the configuration set in the Investment Profile Under "Strategy Exit". For example one cause is the reaching of the maximum of the configured profit or the stop loss.
11.2.5. Your First Strategy
Write your first strategy with this simple rule: buy when the last minute close is below the VWAP and the candle is red (close < open).
  1
2
3
4
5
6

  function beginTrading(context){
  var candle = Intraday.now();
  if( candle.close < candle.vwap && candle.close <= candle.open ){
    return { invest: true, reason: "My 1st strategy!" };
  }
}
| 1 | Contains the function name. It’s generated by the editor, no need to change it |
| 2 | We’re getting the latest candle by calling the function [Intraday.now]() from the package [Package.Today] |
| 3 | Contains the full logic of the strategy: invest if the close price of the candle it’s less then its VWAP and if the candle is red (close ⇐ open) |
| 4 | Return an object with invest: true and the reason to invest |
The reason field is very important because it’s saved in the trade and displayed in the Live Trading page. Let’s write something more useful for the reason:
  1
2

  return { invest: true,
         reason: "Bought because close(" + candle.close + ") < vwap(" + candle.vwap + ")" };
| 1 | invest: true means a new robot will be started |
| 2 | The reason that explain why we’ve decided to trade this stock |
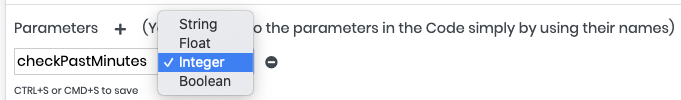
This is another example of a simple strategy that buys a stock after X minutes of uptrend. Uptrend here is defined as consecutive green candles. You can define multiple variables X, Y, Z, etc. as parameter of the strategy. Much better to assign a more meaningful name than just X. In our example we’re going to add a new parameter "checkPastMinutes" of type Integer.
Now this is the code.
  1
2
3
4
5
6
7
8
9
10
11
12

  function beginTrading(context){
  for( var index = 0; index < checkPastMinutes; ++index ){
    var past = Intraday.relative(-1 * index, true, true);
    if( past === null )
      // NO ENOUGH HISTORY
      return;

    if( past.close <= past.open )
      return;
  }
  return { invest: true, reason: "Uptrend for " + checkPastMinutes + " minutes" };
}
| 1 | Contains the function name. It’s generated by the editor, no need to change it |
| 2 | The parameter "checkPastMinutes" is used for the loop. As you can see, parameters are immediately available inside our Javascript function |
| 3 | We’re using the function [Intraday.relative] from the package [Package.Today] to move back in the past relatively to the current candle ([Package.now]) we used in the first example |
Parameters are set as local variable to the function. If you define a parameter in the function, but no value is passed at run-time during the execution, you can assign a default value like with this example in Javascript:
  var checkPastMinutes = (typeof checkPastMinutes === 'undefined') ? null : checkPastMinutes;
  if( checkPastMinutes == null )
    checkPastMinutes = 2;
Global Variables
The usage of global variable is not allowed, because Arcade Trader reset the execution context every time. This allows to run thousands of strategies per second on each server. Instead of using a global variable, you can store values in the Robot context space by using function Robot.setProperty() and Robot.getProperty() to retrieve the value back. Look at this example to store a counter “retry” that is incremented between executions.
  let retry = Robot.getProperty("retry");
  if( retry == null )
    retry = 1;
  else
    retry += 1;
  Robot.setProperty("retry", retry);
You can store strings, numbers, objects and arrays.
11.2.6. Debug
While debugging step-by-step strategies is now supported yet, the best way to understand the flow of strategies is to use the javascript print() function.
All the output from the strategy will be collected and shown in the [BackTest] result page.
Example:
function beginTrading(context){
  var candle = Intraday.now();
  if( candle.close < candle.vwap && candle.close <= candle.open ){
    print( "Close/VWAP = " + ( ( candle.close - candle.vwap) * 100 / candle.vwap ) + "%" );
    return { invest: true, reason: "My 1st strategy!" };
  }
}
11.2.7. Realtime Stream
Arcade platform is connected with multiple streams from the exchange and it’s able to receive and process hundreds of thousands of messages per second. These messages are the [Tick] messages. This means you can build strategies like a High Frequency Trader.
Example of a strategy "FlashCrash" that buys when the last traded price is much lower than the last close.
Define a parameter minCrash of type float.
  1
2
3
4
5
6
7
8
9
10
11

  function beginTrading(context){
  if( Intraday.marketStatus() == "Regular" && Market.minutesToClosing('Regular') > 15 ){
    if( Intraday.todayVolume() < minVolume )
      return;

    var lastCandle = Intraday.now();
    var delta = ( Realtime.lastTradePrice() - lastCandle.close) * 100 / lastCandle.close;
    if( delta < minCrash )
      return { invest: true, reason: "Flash crash of " + delta + "%" };
  }
}
In this example, the strategy checks that the current market is the "Regular" one (market is open and not in [ExtendedTradingHours]) by using the function [Intraday.marketStatus]. Furthermore, it must be at least 15 minutes before closing by using the function [Market.minutesToMarketClosing]. By using the function [Realtime.lastTradePrice]() of the package [Package.Realtime], we can access to the last trade in real-time.
Other available functions of the Realtime package are:
-
[Realtime.lastQuoteAsk] to access to the last ask price
-
[Realtime.lastQuoteBid] to access to the last bid price
If the Realtime package is used, the strategy will be invoked at every trade tick message if the function [Realtime.lastTradePrice] is used, and at every quote tick message if the function [Realtime.lastQuoteAsk] or [Realtime.lastQuoteBid] are used.
| The Realtime package is an advanced feature, check your subscription if the Realtime package is included or ask for an upgrade. |
12. Patterns
A Pattern is a Business Logic the user develop, tests and uses in Alerts. When a Pattern "matches" means that the execution of the Business Logic returns true in a specific context for a symbol.
12.1. Development
The easiest way to develop a pattern is by using the Natural Language, a powerful way to write algorithm by just using sentences.
You can create a pattern to be used on multiple alerts, or you can embed a pattern inside the [Alert] itself. This happens when you click on a price line in the CandleStick Chart.
Some examples:
-
last minute close is above 145.34to be notified when the last close is above a certain price -
last day 150 exponential moving average crosses above 200 exponential moving averageto be notified when in the previous day there was an EMA 150/200 cross over -
real-time trade price is above ask priceto be notified in real-time when a stock is traded above the latest ask price -
last minute macd value crosses above macd signal and last minute close is above 200 emato be notified when a MACD reversal is happening during an uptrend
Check out more about Natural Language syntax.
12.1.1. Expressions Editor
The goal of the Expressions Editor is to let not-programmer to write a Pattern by just writing conditions.
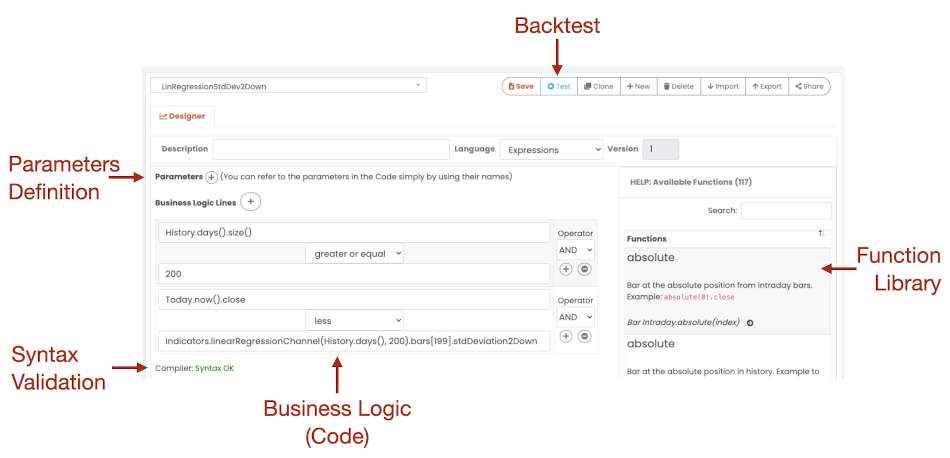
Usually a pattern is made of multiple conditions. The Expressions Editor uses the Javascript syntax for conditions. If you don’t know Javascript you can take this quick course to get the basics of the language W3Schools Javascript Free Course.
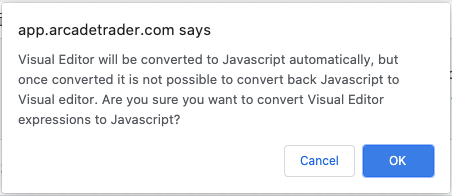
You can start with the Expressions Editor and then migrate to Javascript or Python. In this case Arcade will convert the Conditions in Javascript or Python automatically. The procedure doesn’t work back from Javascript/Python to the Expressions Editor.
Create your first Pattern with the Expression Editor
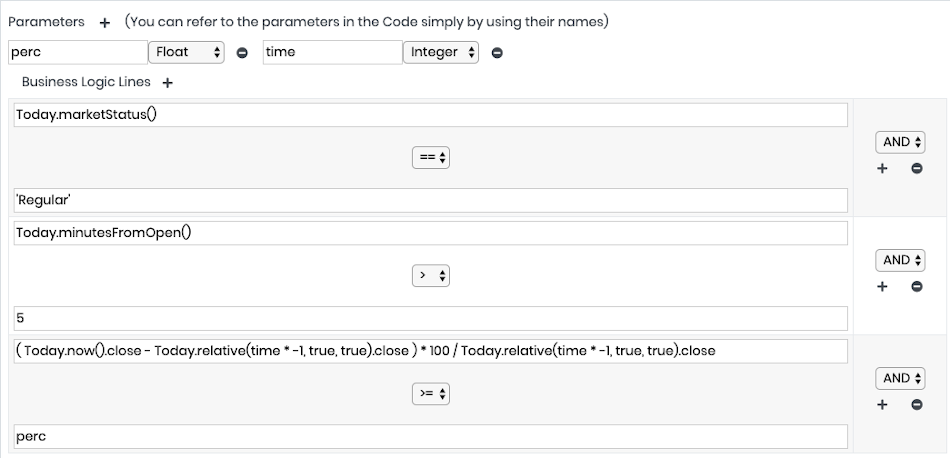
it’s time to create your first pattern. Let’s call it "Gain". The goal is to catch a gain of price by comparing the close price of the last bar (minute) with X minutes ago. If the gain is more than Y, then the pattern returns true and any associated Alert will fire.
For our convenience, let’s call X "time" and Y "perc" and define them as parameter. "perc" is a float and time is an integer, because it represents the number of minutes to look back in the past.
First things first. We want this pattern to be fired only during Regular Market Hours and after 5 minutes from the open, because it’s quite normal in the first minutes of the market to have such spikes. For this reason, let’s add the following 2 conditions:
Intraday.marketStatus() == 'Regular' AND
Intraday.minutesFromOpen() > 5
The operator AND means both the conditions must apply.
Instead with OR it’s sufficient that one of the two conditions is true.
The function Intraday.marketStatus() returns the name of the current market.
"Regular" is the Regular Market.
The function Intraday.minutesFromOpen() returns the number of minutes from open.
Now let’s add the most important part of our logic: checking how much was the Gain if any.
To get a previous minute in time from the intraday history, we can use the function Intraday.relative(<offset>, <same-day-only>, <extended-hours>).
For our case we need to go back in time, so offset will be a negative number calculated as the value of time parameter multiplied by -1:
Intraday.relative(time * -1, true, true)
This function returns the entire Bar as an object.
We need the close price, so add .close to get the "close" attribute of the bar.
To see all the attributes in a bar, check Bar Reference.
To get the latest bar (of the last minute received) we will use another function Intraday.now().
This function returns a bar too.
Now we’ve got everything to compute the percentage of the delta between the last close price and the close price of X minutes ago:
( Intraday.now().close - Intraday.relative(time * -1, true, true).close ) * 100 / Intraday.relative(time * -1, true, true).close
In the last condition of the Business Logic let’s add this expression with the condition to be >= of the value of the parameter perc.
The Business Logic will look like this:
Now to test this Pattern you can jump on Backtest Pattern or we can create an Alert.
Remember to pass the values for the 2 parameters time and perc defined in the Pattern.
Begin with using 2 for perc and 10 for time to see if there is any gain of 2% in the past 10 minutes for the symbols specified in the Alert Universe.
12.1.2. Javascript
By using Javascript you can use variables, loops, etc.
The most important thing with Javascript is that the last statement must contain the final result. Don’t use return, because it’s not a function.
Example of the previous "Gain" Pattern converted in Javascript:
( Intraday.marketStatus() == 'Regular'  ) &&
( Intraday.minutesFromOpen() > 5  ) &&
( ( Intraday.now().close - Intraday.relative(time * -1, true, true).close ) * 100 /
    Intraday.relative(time * -1, true, true).close >= perc  );
12.1.3. Python
By using Python you can use variables, loops, etc.
The most important thing with Python is that the last statement must contain the final result. Don’t use return, because it’s not a function.
Example of the previous "Gain" Pattern converted in Python:
( Intraday.marketStatus() == 'Regular' ) and \
( Intraday.minutesFromOpen() > 5 ) and \
( ( Intraday.now().close - Intraday.relative(time * -1, true, true).close ) * 100 / \
    Intraday.relative(time * -1, true, true).close >= perc  )
12.1.4. Using indicators
In Arcade, every bar has the most common indicators already computed, such as SMAs, EMAs, RSI, MACD and others.
Now let’s create a pattern that notify us with an alert when the SMA50 indicator crosses over the SMA200. We just need two conditions in AND. We can write this with the visual editor, in Javascript or Python. Let’s take a look at the Javascript version:
 ( History.last().sma50 >= History.last().sma200  ) &&
( History.relative(-1).sma50 < History.relative(-1).sma200 );12.1.5. Parameters
A Pattern can have parameters that are visible in the Business Logic by their name.
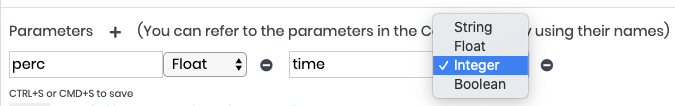
A parameter can be of the following types:
-
String
-
Float
-
Integer
-
Boolean
When you create an Alerts you can specify the value to pass to the Pattern as parameters.
Patterns can be written by using in Natural Language, Expressions, Javascript and Python.
12.1.6. Execution Time
Arcade compiles patterns developed in any of the supported languages into low-level machine code for the maximum of performance. Usually a pattern is executed in less than 1 millisecond. If you’re using Arcade Enterprise (On-Premise) there are no limits with the execution time. Instead, if you’re using the Cloud version, the maximum execution time for a pattern is based on your subscription plan. Check your plan in Cloud Plans.
12.2. Backtest Patterns
Once you’ve written your pattern, to see how it works you can backtest for some days to see how many times the pattern matched in the past for a set of symbols.
To test your pattern, click on the "Test" button and you’ll be redirect to the Backtesting Patterns page where the following popup will be shown.
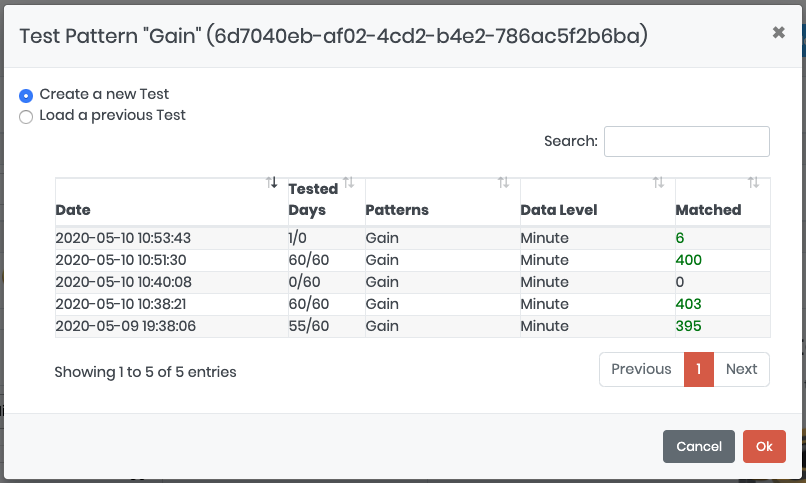
If this is the first time you’re testing a new pattern, click on Create a new Test. Otherwise, you can select on an existent configuration to clone.
Check out the Backtesting Patterns page.
13. Backtesting
Algo Traders Spend more than 70% of Time Backtesting.
Thorough backtesting is required to gain confidence in an algorithm before putting money behind it. Arcade has the most advanced and efficient backtesting engine running on a custom developed multimodel timeseries database, allowing it to reproduce the same sequence of Live Market events at >100X its speed. Millions of tick messages are replayed with the same order for maximum accuracy of your test results.
You can backtest both Strategies and Patterns.
Backtesting is a very CPU and IO intensive job that requires a lot of resources to support thousands of users. The Arcade Platform automatically scales the cluster of test machines according to demand. Check with your subscription to see how many Arcade Tokens are included weekly. The tokens included with the Cloud subscriptions are earned every week. Those tokens, if not used, expire on Sunday 12:00 am EST and are not cumulative. Extra tokens are available to be purchased separately and work with all Cloud subscriptions with no expiration. Tokens are not refundable and can’t be transferred to other users. Each test can include multiple strategies at the same time with no extra cost. Look at Arcade Tokens to know more.
| Enterprise plans run backtesting on on-premise servers, so there is no such limitation with the backtesting. You can install the Enterprise version on a data center to benefit of quick backtesting. |
13.1. Understanding Data Level
Strategies and Patterns can be executed at the different levels. Check your subscription to understand what’s the maximum data level available for you:
-
Day: executed twice a day, at market open and at market close
-
Minute: executed every minute. The time range goes from 8:00 am EST (pre-market hours) to 6:00 pm EST (post-market)
-
Trade Tick: executed at every trade tick received from the market. The time range goes from 8:00 am EST (pre-market hours) to 6:00 pm EST (post-market). There can be a thousand trade ticks in a second
-
Quote Tick: executed at every quote tick received from the market. The time range goes from 8:00 am EST (pre-market hours) to 6:00 pm EST (post-market). There can be thousands of quote ticks in a second
The more detailed is the level, the most accurate are the test results. This is extremely important for day traders that execute multiple trades in a day because a price can change many times in a minute. There can be a thousand trade ticks in a minute.
13.2. Backtesting Strategies
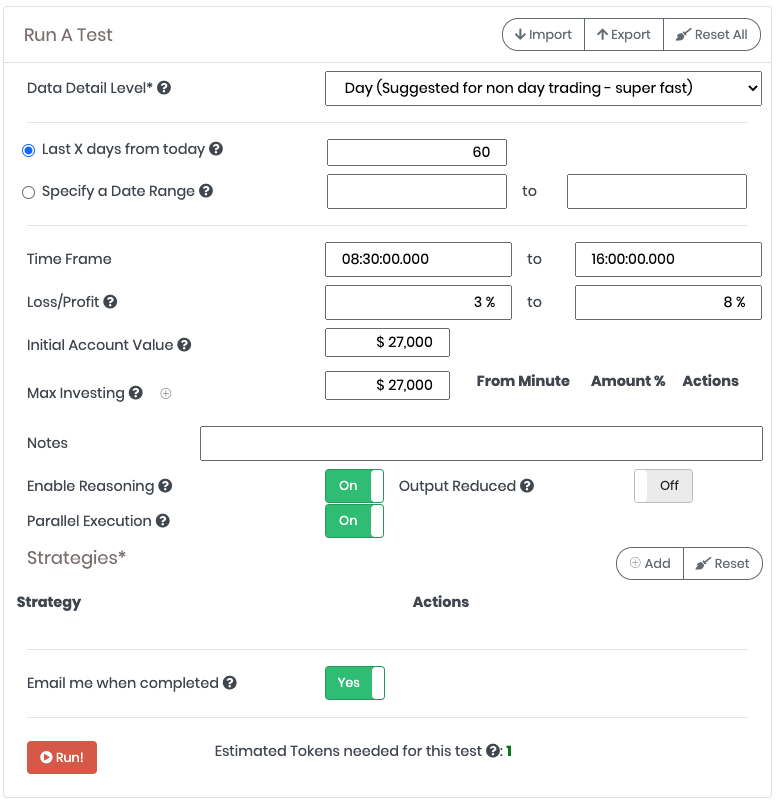
In order to be accurate, Arcade Trader provides many settings for backtesting. Before getting into the details of every single setting, let’s take a look at the page.
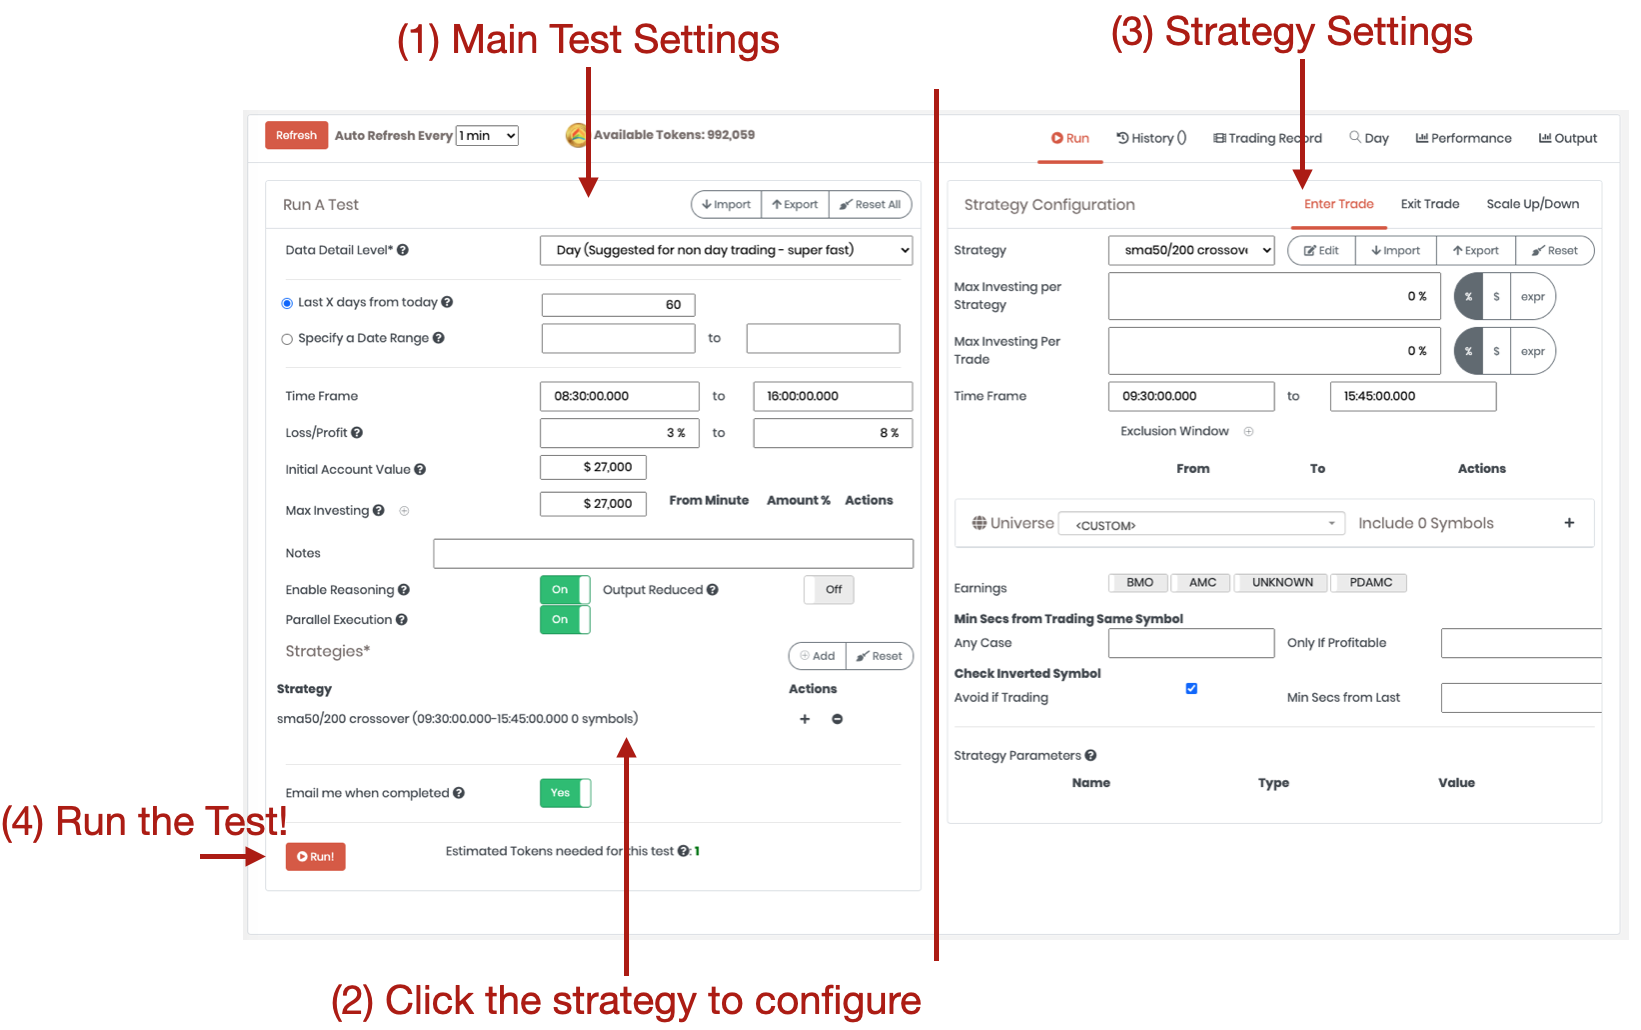
The page is split in two parts, the (1) main Test Settings on the left where you can (2) click the strategy to configure it on the (3) Strategy Settings panel on the right. When you’re ready to go press the (4) "Run!" button to run the Test.
13.2.1. Test Settings
The left panel contains the Test Settings with the following buttons and fields in order:
-
Import button: imports a test configuration previously exported with the Export button
-
Export button: exports a test configuration in JSON format to be imported by using the Import button
-
Reset All button: resets the configuration
-
Data Detail Level: is the level of detail of execution. Check Understanding Data Level
-
Period of execution, it could be expressed as:
-
Last X days from today: set the number of days you want to test. A year is about 252 trading days
-
Specify a Date Range: set the date from/to for the test
-
-
Timeframe: it’s the range of testing for each day By default, is 09:30 am - 4:00 pm EST time that corresponds at the regular market time. Change this if you want to trade also during after hours (pre-market starts at 09:00 am EST time and post-market ends at 06:00 pm EST time)
-
Loss/Profit: are the boundaries of loss and profit in a day when Arcade stops the trading (and ends all the intraday strategies if any) if reached. By default, is 3% loss and 8% profit for intraday strategies that means if a profit of at least 8% is reached or a loss of more 3% or more, then Arcade anticipates the day closing and stops any new trading.
-
Initial Account Value is the amount of money in the account when we start the test. By default, is $27K that is just above the minimum of $25K requested by the SEC for day traders
-
Max Investing is the maximum of investing per day. 0 means the total amount in the account. By default, is $27K that means even if the test is having a profit and the total amount is increasing, not more than 27K are going to be invested every day. If you set this value to 0, the total amount in the account will be traded every day
-
Max Investing Timeframe: you can define different rule on the max investing during the day starting from a specific minute how much to invest in percentage
-
Notes: description about the test
-
Enable Reasoning: not supported yet
-
Output Reduced: not supported yet
-
Parallel Execution: If enabled, the test will be split in multiple units, one per day, and executed on all the available testing nodes of the cluster. This provides quicker results, but doesn’t allow to test trading that are spanned on multiple days
-
Strategies: strategies to execute. You can add, remove and update the strategy by clicking on the strategy and the strategy settings will be open on the right panel
-
Email me when completed: send an email with the summary of the results when the test is completed
-
Run button: schedule the test
Coming Soon
13.3. Backtesting Patterns
In either ways, once you’ve selected your option you can edit the test parameters:
-
Data Detail Level: is the level of detail for the test:
-
Minute: this is the fastest test available for day trading. It invokes the patterns multiple times per minute. Suggested for quick tests of day trading patterns. It simulates produces quote and trade messages at the beginning of the minute, 2 time in the minute and at minute closing.
-
Tick Compressed: (not supported yet for patterns) this is the recommended level for detailed day trading. It invokes the patterns at every tick (quote and trade), but the recording of the market is compressed by ignoring the ticks that are not useful for non-HFT patterns. Suggested for accurate testing of day trading patterns. Slow execution.
-
Tick: (not supported yet for patterns) this is the recommended level for HFT patterns only. It invokes the patterns at every tick (quote and trade). Super slow execution.
-
-
Last X days from today: When selected, allows to specify the number of days to test back from today. 30 means testing the last 30 days from today
-
Specify a Date Range: When selected, allows to specify a range of dates. if there are any missing data for some of the days included in the range, the day is simply ignored
-
Time Frame Range: the range of time to backtest
-
Notes: a free text description of the test you can update later
-
Patterns: is the list of patterns to test. This is limited by your subscription plan. Press
+ Addto add a new pattern. PressResetto remove all the patterns
Once you add a new pattern or you click on it, on the right side of the screen you can see the test configuration for the pattern.
-
Pattern: select the pattern to run
-
Universe: select the Universe of symbols to test, or hand pick some of the symbol you’re interested in
-
Earnings: (not supported yet)
-
Skip Minutes Between Findings: after a match, skips the following minutes before checking again. This is useful to avoid multiple matching in the same period
-
Pattern Parameters: are the parameters defined in the pattern. Fill the value to pass to the pattern during the execution. To change the parameters, edit the pattern definition by clicking on the
Editbutton
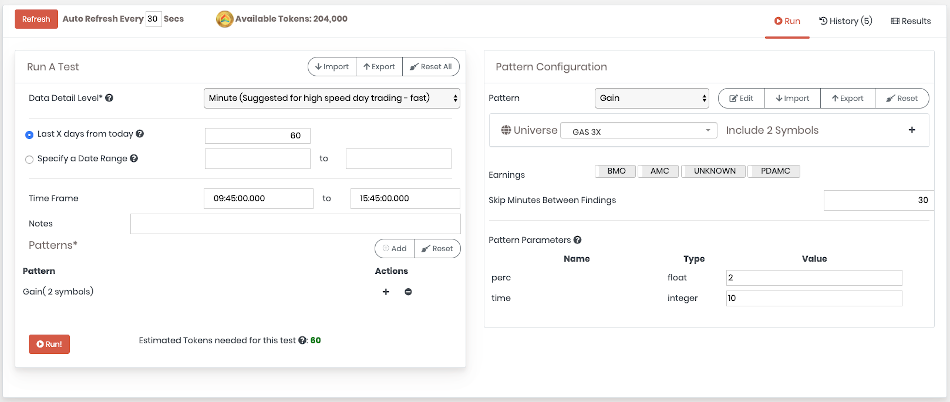
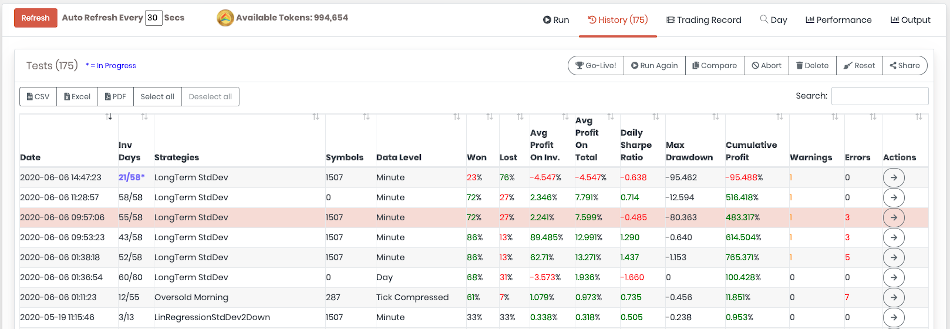
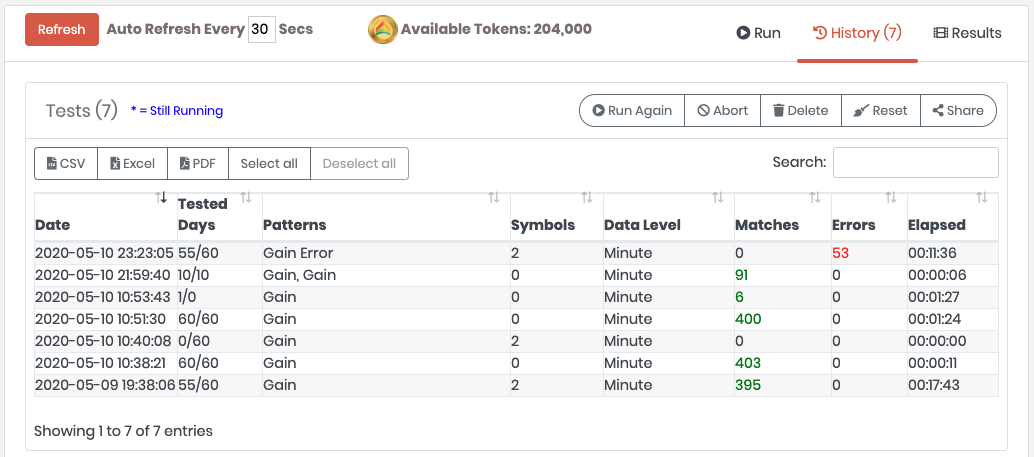
Click the Run button and check the results. The execution of the backtest is executed on a cluster of servers in the cloud. You can check the status and see partial results by clicking on the History tab.
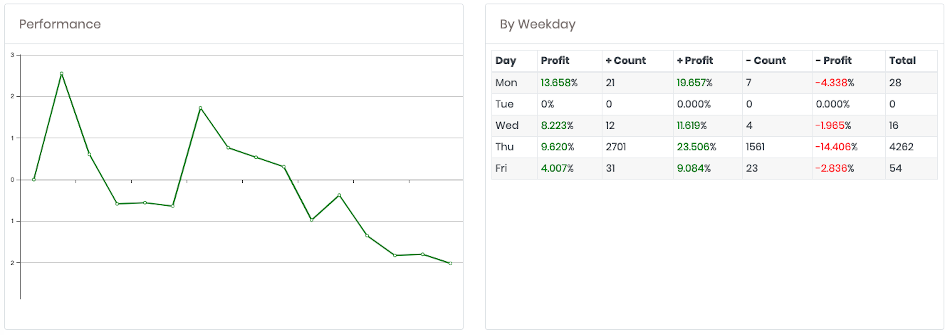
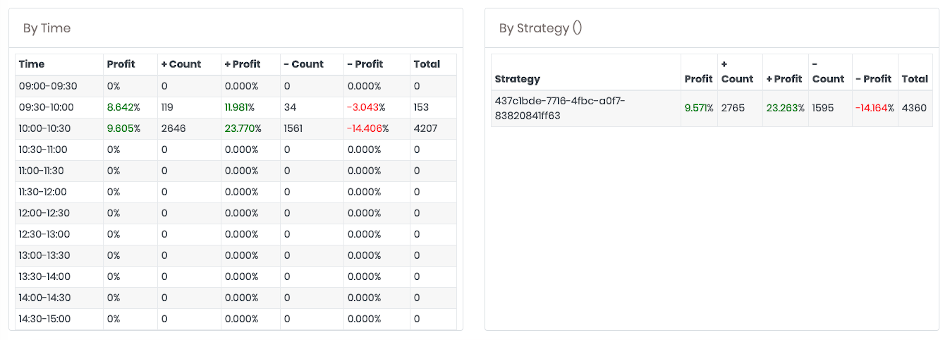
Below an example of the Gain pattern we wrote earlier, applied on the Natural Gas ETFs.
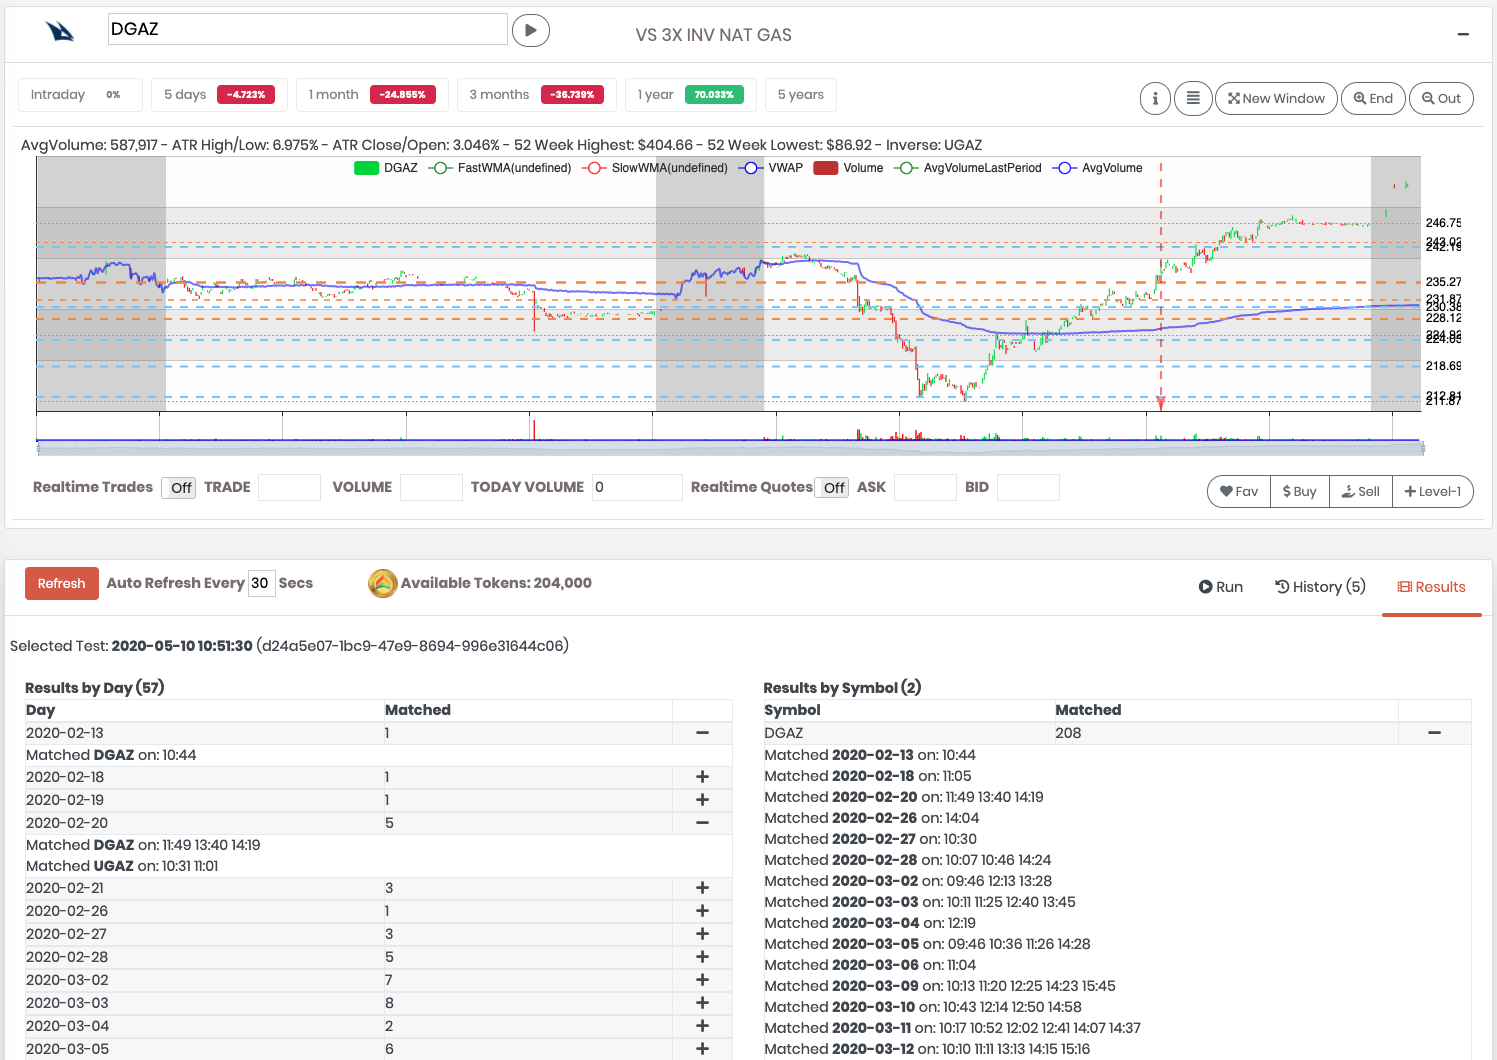
You can expand the findings per day and per symbol. By clicking on the time the pattern has been found, the Candlestick Chart Wiget will show that exact moment on the chart by pointing to the minute with a red arrow.
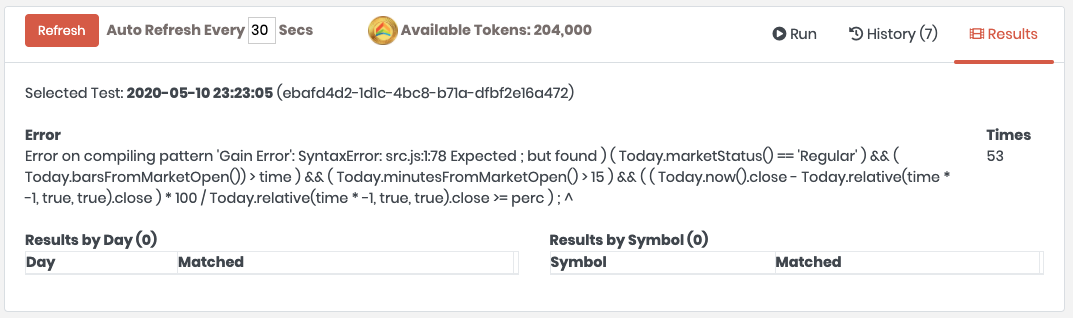
In case of errors, most commonly Syntax Error in the Pattern, you will see the errors in the detail of the test.
14. Alerts
Arcade allows the user to create custom alerts triggered by a pattern on a universe of symbols. Alerts are not saved permanently in Arcade, and they are visible only during the current day of trading. If you want to save the alerts, enable the sending of the email so you can collect them in your Email inbox.
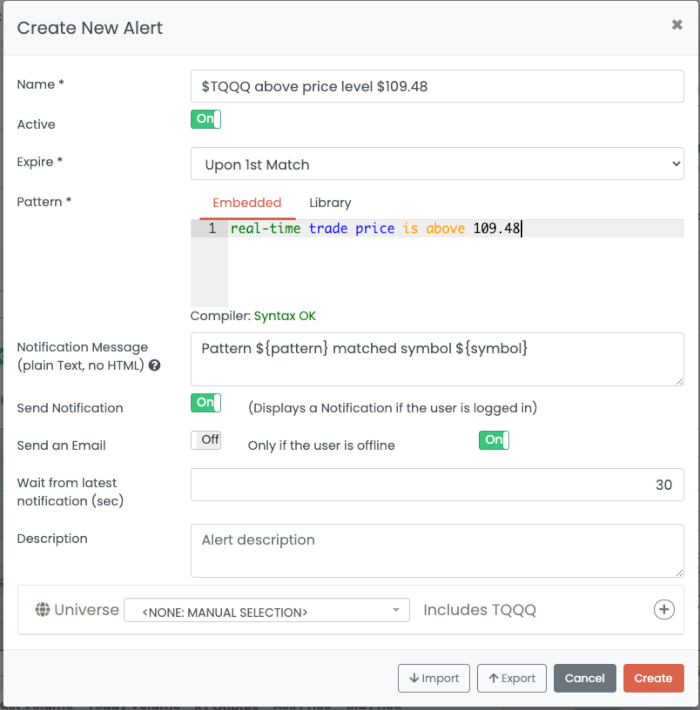
14.1. Create and Edit an Alert
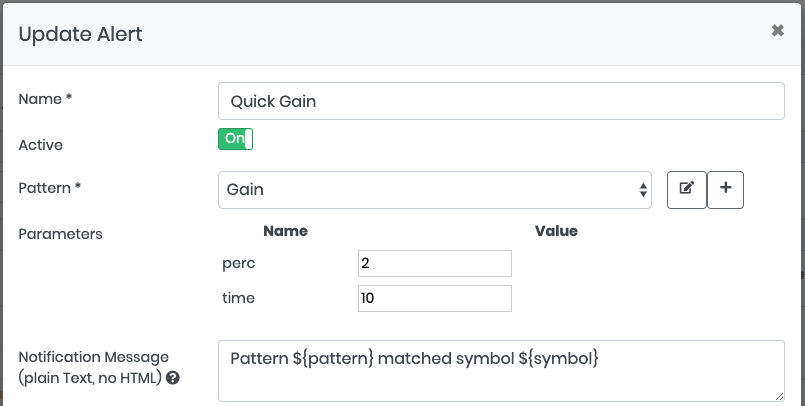
In order to create a new alert, click on the "+ Create a new Alert" button at the top of the Definition panel. In both Add and Edit mode, the following popup is shown.
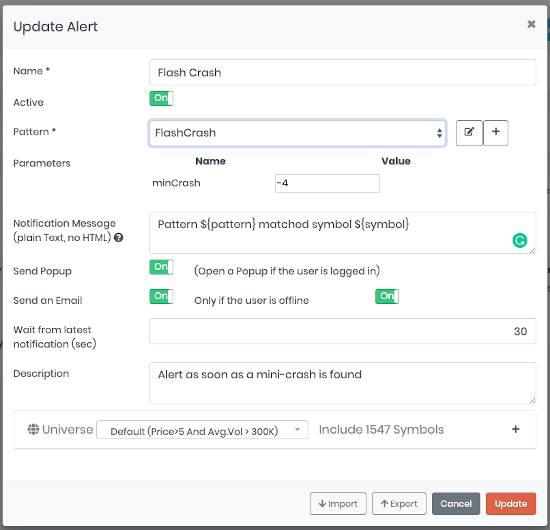
-
Name: (mandatory) is the name of the alert
-
Active: (mandatory) is active the alert will be enlisted under the Active Alerts table, otherwise under the Inactive Alerts table. You can temporary disactivate an alert by setting this switch to Off.
-
Pattern: (mandatory) select the pattern that triggers the alert. You can edit the selected pattern by clicking on the edit icon or create a new one if you click on the "+" icon.
-
Parameters: fill the values to be passed as parameter to the pattern. Values will be converted to the type declared in the pattern definition.
-
Notification Message: it’s the notification message. You can use the following variables:
-
${name}: Name of the Alert. -
${pattern}: Name of the Pattern. -
${symbol}: Current symbol. Example: TSLA. -
${date}: Current date in the format 'yyyy-MM-dd HH:mm:ss.SSS'. Example: '2020-02-25 13:12:33.999' -
${trade.price}: Trade Price if the event has been initiated by a Trade Market message. -
${trade.volume}: Trade Volume if the event has been initiated by a Trade Market message. -
${quote.askPrice}: Quote Ask Price if the event has been initiated by a Quote Market message. -
${quote.bidPrice}: Quote Bid Price if the event has been initiated by a Quote Market message. -
${msgId}: Market message unique id number.
-
-
Send Popup: if enabled, open a notification if the user is logged in
-
Send an Email: send an email for the alert. The email will contain the information about the alert.
-
Only if the user is offline: send the email only if the alert is fired while the user is not logged in
-
Wait for latest notification: wait a defined number of seconds between the same alert on the same symbol. This avoids having multiple alerts for the same event.
-
Description: Description of the alert
-
Universe: Specify the Universes or pick manually the symbols you’re interested in.
-
Import button allows to import an exported alert configuration
-
Export button allows to export an alert configuration
When you create or update the alert, the alert is reinstalled in Arcade. This means that if you have changed the Alert’s pattern, the Alert code will be recompiled. Check the status in the image below.
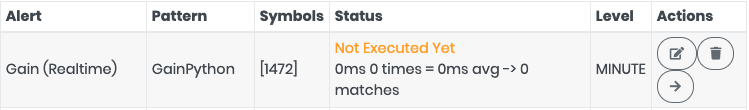
14.2. Alert Execution
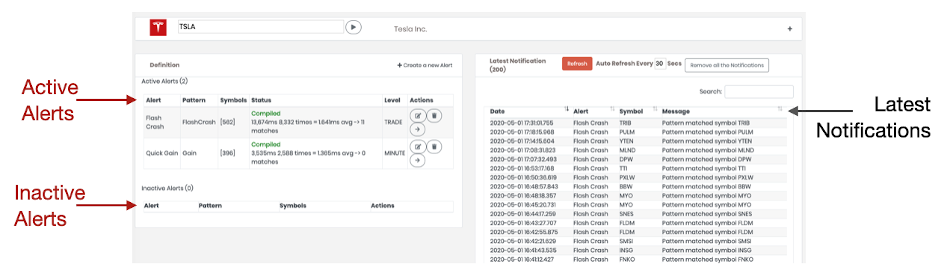
At the very first execution, the Alert is compiled with the code created in the linked pattern. If there are no errors, then the Status is "Compiled" with some metrics about the Alert execution.
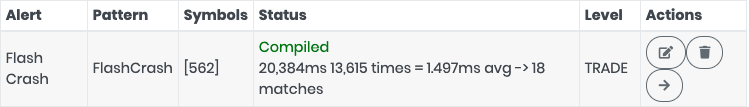
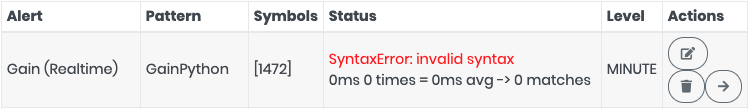
If there are any Syntax Error or Critical Execution Error, the Alert is temporary suspended until the error has been resolved.
To resolve an error, edit the linked pattern, fix the error and then Edit the alert and just click on the "Update" button. In this way the Alert will be reinstalled and therefore recompiled.
| The "Level" column tells when the Alert is executed (Minute, Trade or Quote Tick). It’s auto determined based on the functions used in the pattern definition. |
In the Action column you can:
-
Edit the alert
-
Delete the alert
-
Filter all the notifications created by the current Alert
14.3. Notifications
On the Notification panel are collected all the notifications for all the defined alarms. Check you plan how many notifications can save. To remove all the Notifications click on the button "Remove all the Notifications". By default, the notifications are refreshed every 30 seconds. You can set 0 to disable the auto refresh. In the Search field you can easily filter the notificaton by date, alert, symbol or Message.
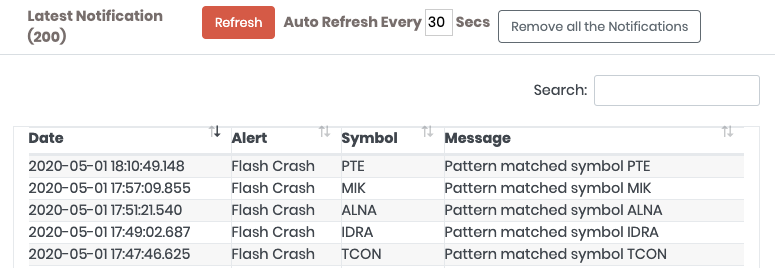
Click on the date to open the CandleStick Widget chart right at the moment the Alert wa fired.
15. Scanner
The Scanner is the tool that helps you find what really matters each day in the market.
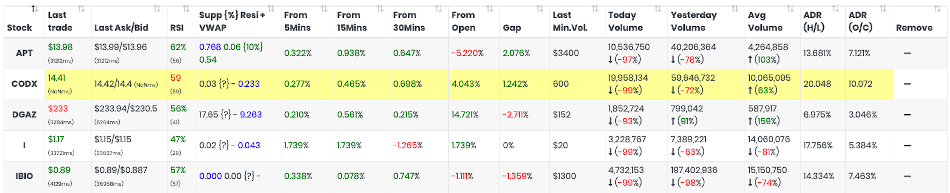
15.1. Performers
The first tab of the Scanner contains the top and bottom performers of the day. You can adjust the filters to see results from the Open, Last Minute, Last 5 or 15 minutes.
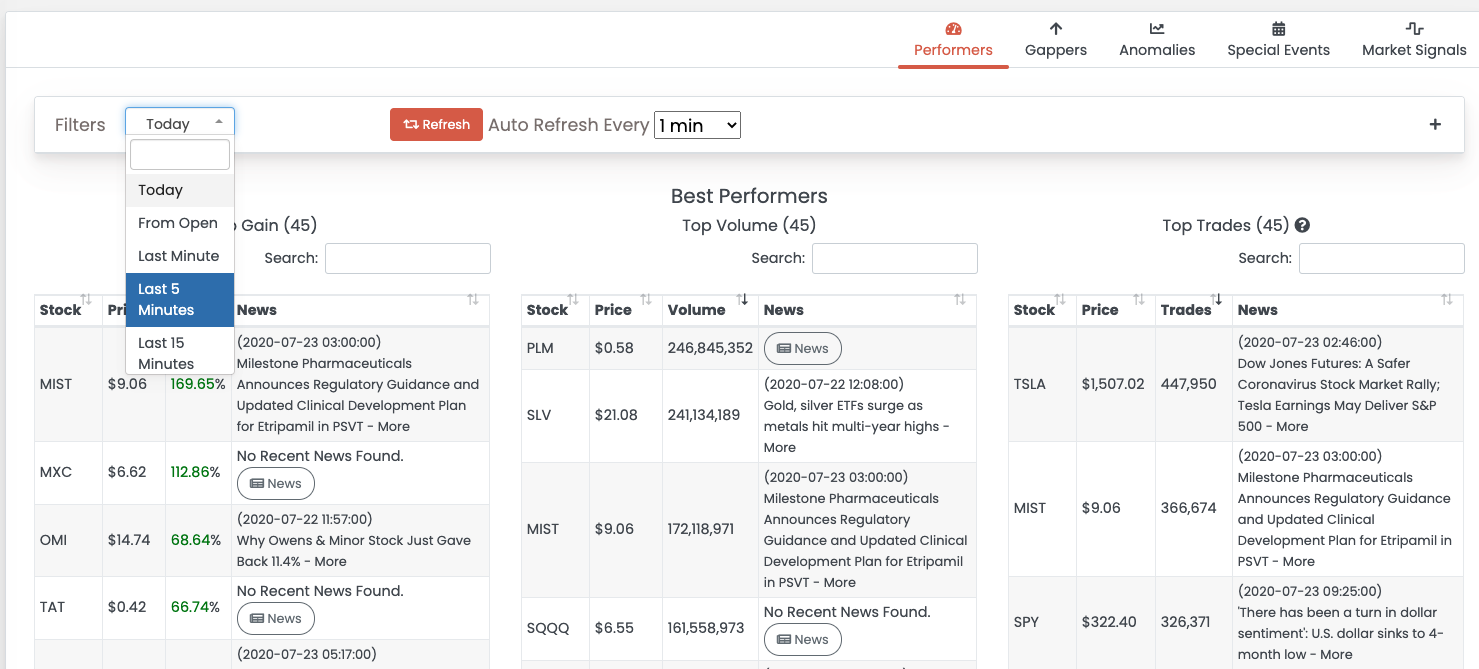
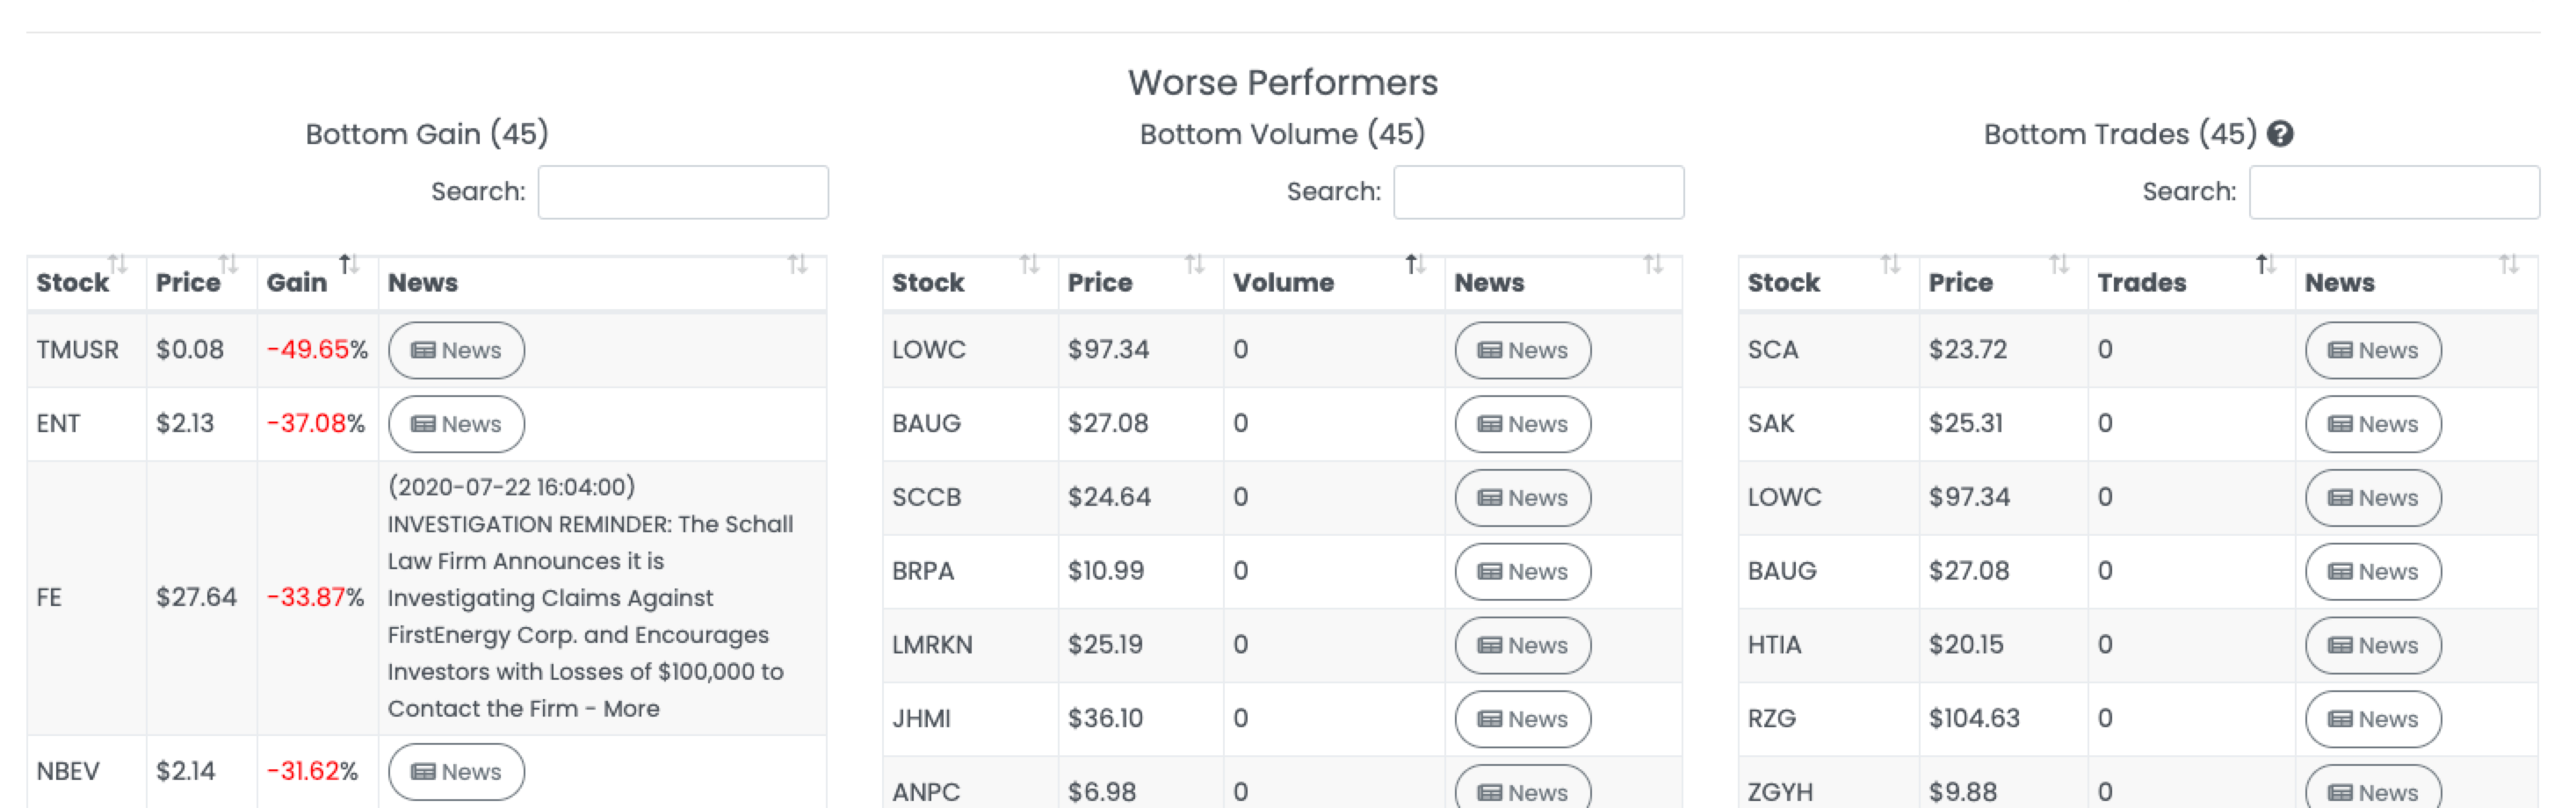
Arcade Trader represents a performers under 3 aspects:
-
Gain
-
Volume
-
Trades, as the number of individual trades. This is an exclusive metric, and it’s quite different from the volume. While the volume collects the total number of traded shares, Trades are the number of individual trades. For example, if a big institution bought 100K shares, the volume would be 100K, but the trades only 1. This metric is important to understand how many players are in the game for that stock in a particular period of time.
Next to the symbol you can find the most recent news. If there are no news, you can refresh by clicking on the News button. If you click on the news, the external article will be opened in a new tab/window.
15.2. Gappers
Gappers are the stocks that are gaining or losing outside the normal trading hours.
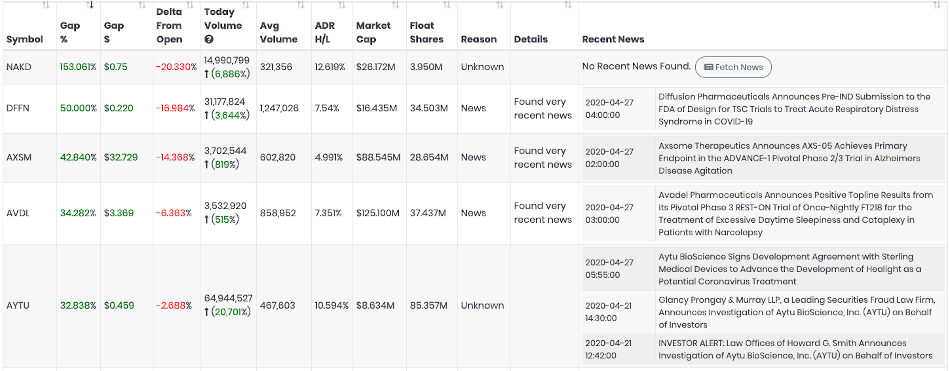
The gappers table contains the reason of the gap. This could be a special event (News, Earnings, Dividend, etc.). Aside to each symbol you can find the recent news fecthed from the most important finance sources. Click on the news to open the original article. If you don’t see any news, you can manually ask for an update by clicking on the button "Fetch News".
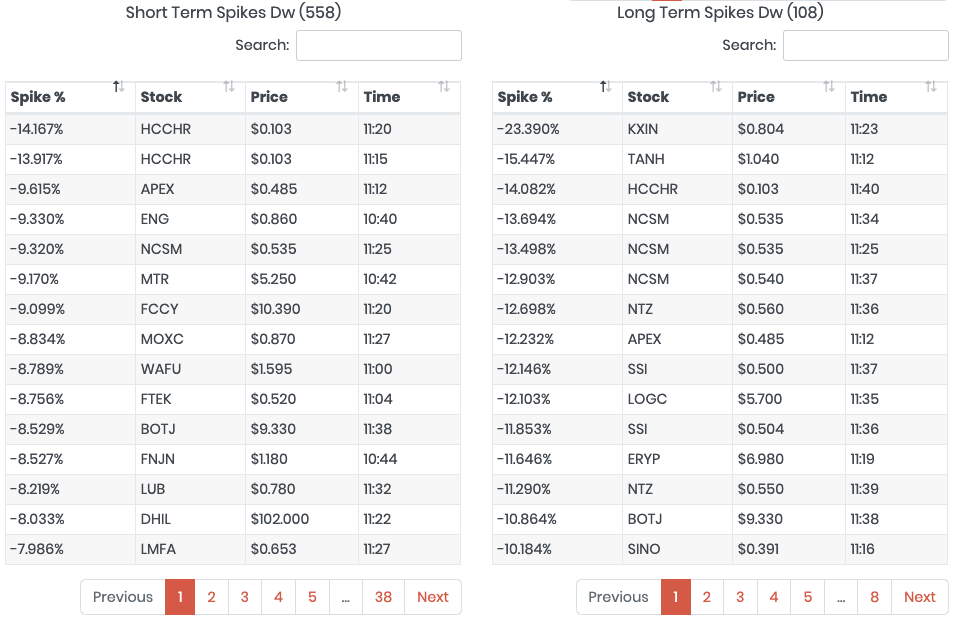
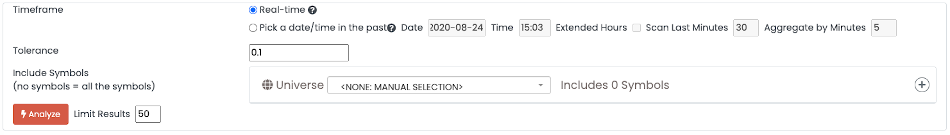
15.3. Anomalies
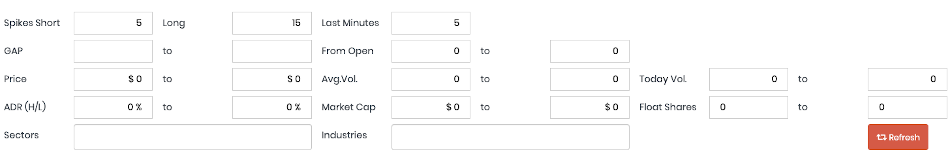
The Anomalies page contains the symbols that are recording anomalies from their average behavior. You can filter the stocks by multiple parameters. Apart from the usual, the following are exclusive to this page:
-
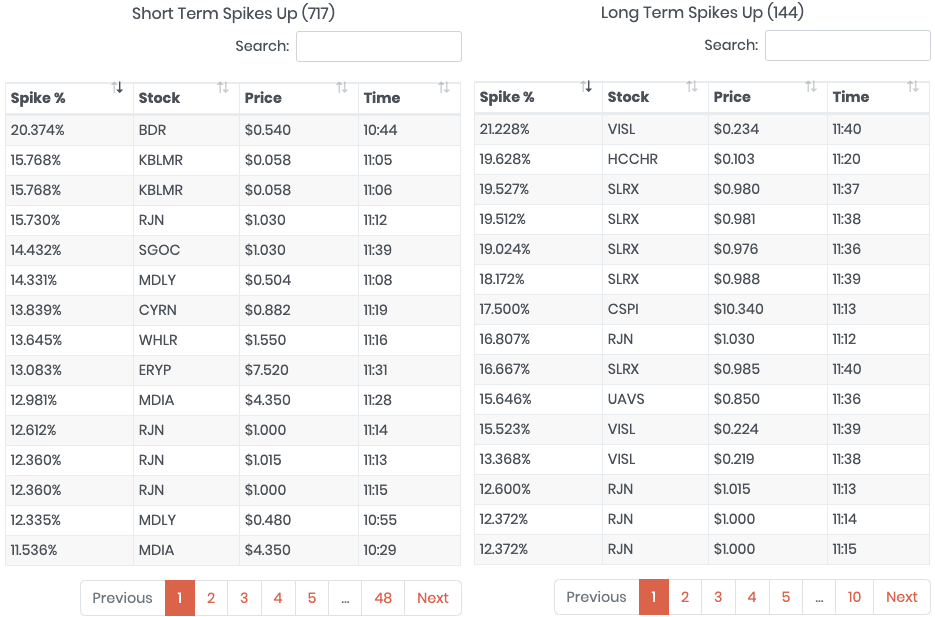
Spikes Short represents the amount of minutes the short spike up and down must be compared with
-
Spikes Long represents the amount of minutes the long spike up and down must be compared with
-
Last Minutes this is used by Volume Analysis and represents how many minutes to look back in the past for anomalies. By default is 5 minutes
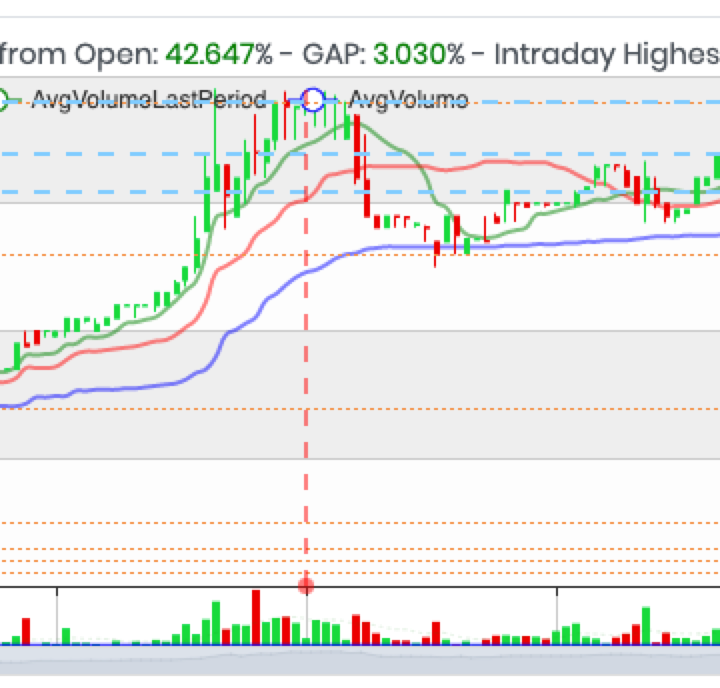
The anomalies analyzed are divided in 6 boxes. Click on the symbol to visualize the anomaly in the candlestick chart. Look at the vertical arrow that indicates the exact minute when the anomaly has been recorded. |
|
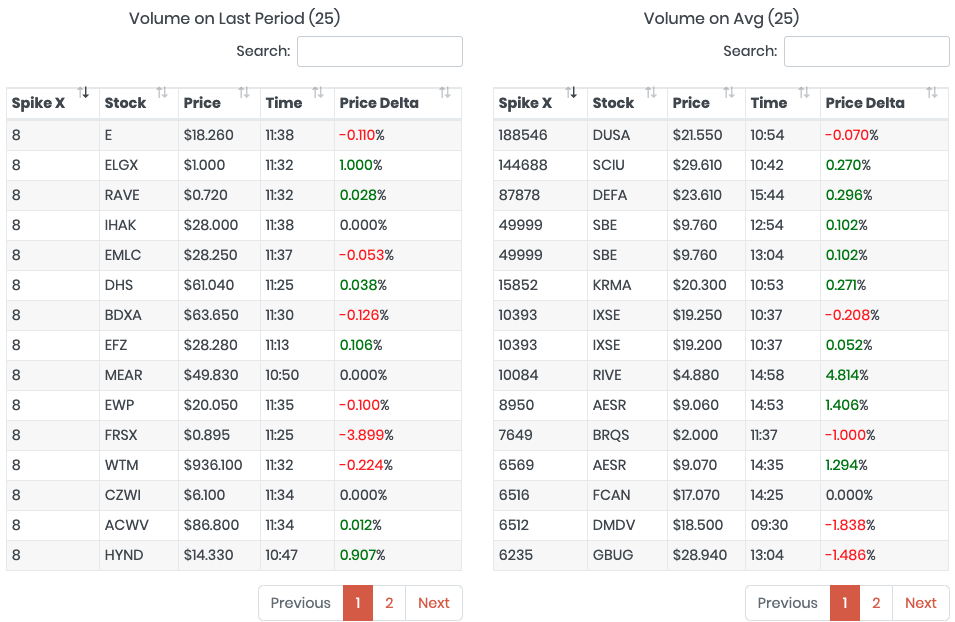
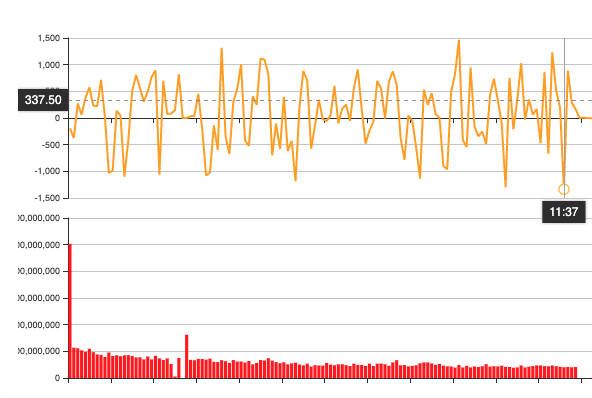
15.3.1. Volume
There are 2 boxes for Volume analysis: (1) On last Period and (2) On Average.
-
Spike X, is how many times the volume is higher than normal
-
Stock, is the analyzed symbol
-
Price, is the last price for the symbol
-
Time, is when the anomaly has been detected
-
Price Delta, is the delta of price recorded since the anomaly
15.4. Special Events
Special Events contains all the symbols that have a special event on a day. The special events are:
-
Dividends (Not supported yet)
-
Weekly Reports such as the OIL and GAS reports
From the top of the page you can filter by the following:

-
Day (by default is the current day)
-
-
BMO Before Market Open
-
AMC After Market Close
-
Unknown The time is unknown, or the earnings meeting could have been canceled or postponed
-
PDAMC Previous Day After Market Close. it means the earnings were announced after the market closing of the previous trading day
-
-
Reports, shows the symbols with a report scheduled for the current day
-
The offset in minute to compute the High/Low of the day
This is the result.
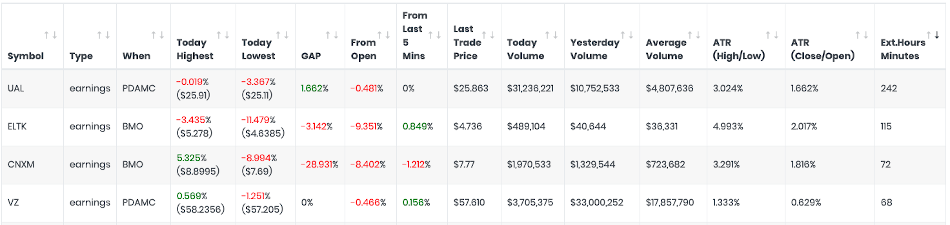
While most of the columns are the same you can find in other pages, the "Ext.Hours Minutes" is important because contains the amount of minutes recorded under Extended Trading Hours. The higher, the most activity has been recorded after and pre market.
17. Settings
17.1. Connectors
In order to access to market data (for real time and historical data), you need an account or subscription that allows to retrieve such information. Arcade supports the following data providers:
-
Polygon.io
-
Alpaca Market
-
TD Ameritrade
-
Robinhood (historical + delayed intraday)

17.3. Set up the Alpaca Key
Login into your account in Alpaca and on the right of the screen you will find "Your API Keys" widget. Click on the "View" button to display your API KEY ID. If you don’t remember the secret generated, please regenerate a new pair of key/secret again and copy them into Arcade Trader under Settings / Connectors.
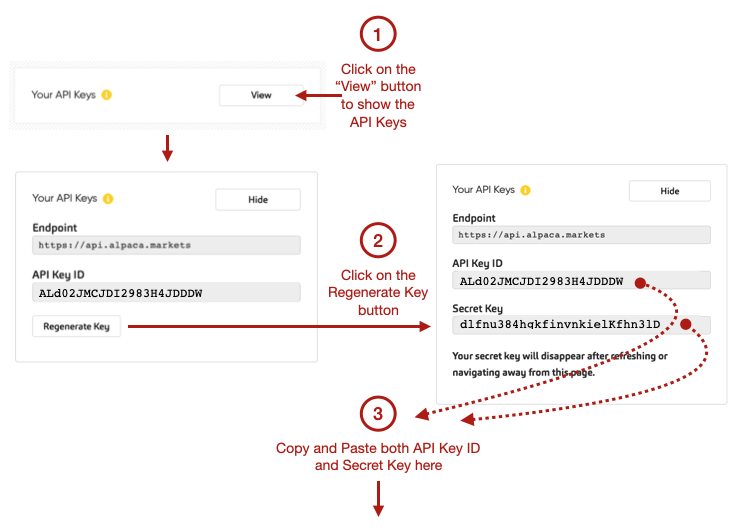
Don’t forget to repeat the same procedure in case you change the Alpaca key or you will see an "Unauthorized" error in Arcade.
| Before March 2021, Alpaca allowed the usage of Polygon.io data for free with all the funded accounts. Unfortunately this is not the case anymore. In order to access to good quality market data you need a subscription to either Polygon.io or Alpaca Data. |
18. Security
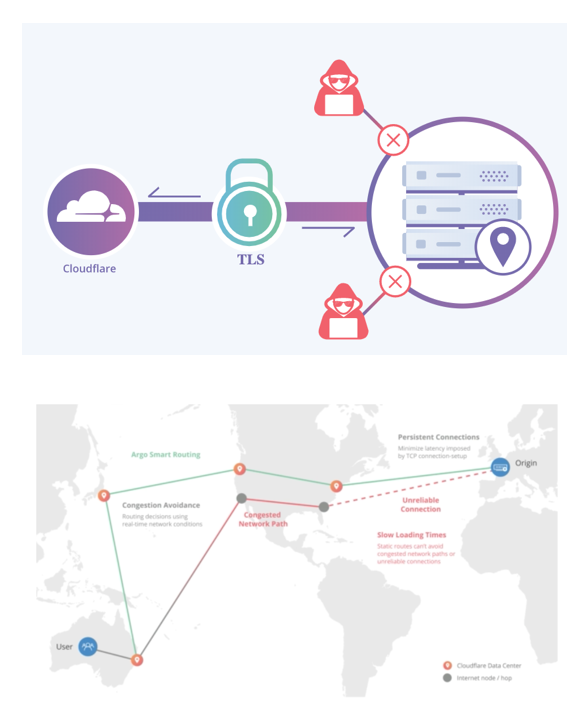
Arcade Trader is partnering with CloudFlare for security and DDoS protection. CloudFlare technology allows the Arcade Servers to run with no open ports by using Argo Tunnels. This means all Arcade servers are hidden and cannot be accessed directly from outside the Arcade Network.
All the connections between the browser and Arcade Servers are encrypted by using SSL/TLS. Cloudflare routes the user to the closest server.
All your private information, patterns, strategies and tests remain isolated from other users, unless you decide to share with somebody.
If you still don’t trust your precious Trading Algorithm is outside your own computer, you can still use Arcade Trader platform with the Enterpise Edition where you install Arcade on you own PC at home or anywhere else.
19. Billing
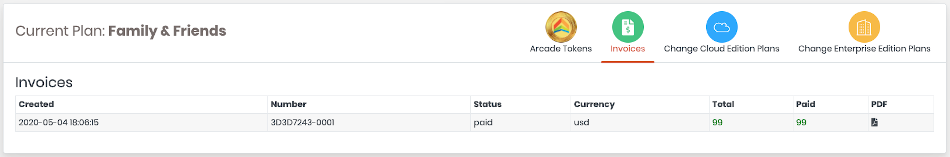
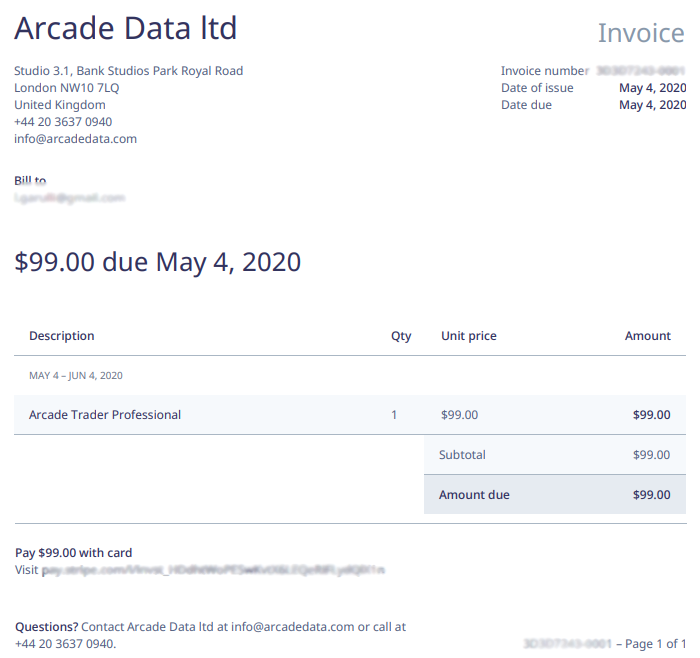
In the Billing Page you can find your Invoices, the Arcade Tokens balance, buy more tokens and change your subscription.
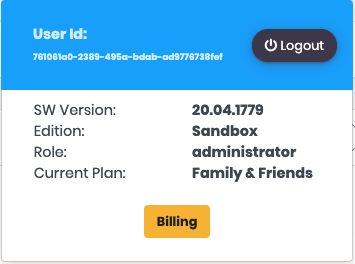
19.1. Access to the Billing Page
In order to access to the Billing page, click on the Profile icon on the top right of the menu bar, then click "Billing".
19.2. Arcade Tokens
|
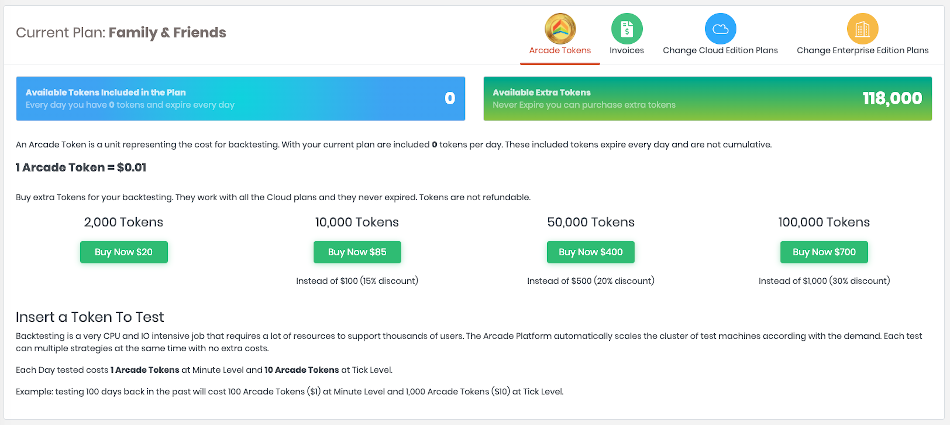
An Arcade Token is a unit representing the cost for backtesting. Check with your plan how many Tokens are already included per week. Extra Tokens are available to be purchased separately and they work with all the Cloud plans with no expiration. Today the value of 1 Arcade Token is $0.01, but it could change in the future. |

19.2.1. Why paying for additional Backtesting time?
Backtesting is a very CPU and IO intensive job that requires a lot of resources to support thousands of users. The Arcade Platform automatically scales the cluster of test machines according with the demand. Check with your plan how many Arcade Tokens are already included per week. The Tokens included with the Cloud plans are earned every week. Those tokens, if not used, expire on Sunday 12:00 am EST and are not cumulative. Extra Tokens are available to be purchased separately and they work with all the Cloud plans with no expiration. Each test can multiple strategies at the same time with no extra costs.
Each Day tested costs 1 Arcade Tokens at Minute Level and 10 Arcade Tokens at Tick Level.
Example: testing 100 days back in the past will cost 100 Arcade Tokens ($1) at Minute Level and 1,000 Arcade Tokens ($10) at Tick Level.
19.2.2. Check your Balance
Click on Arcade Tokens tab to check your balance of both:
-
Tokens included in your plan (expire every end of the week if not used)
-
Extra token purchased (no expiration)
To purchase extra tokens for your test, click the button with the number of token to buy. The more token you buy, the major is the discount.
| If you often need a lot of tokens, please evaluate to change your plan to have more token every week. |
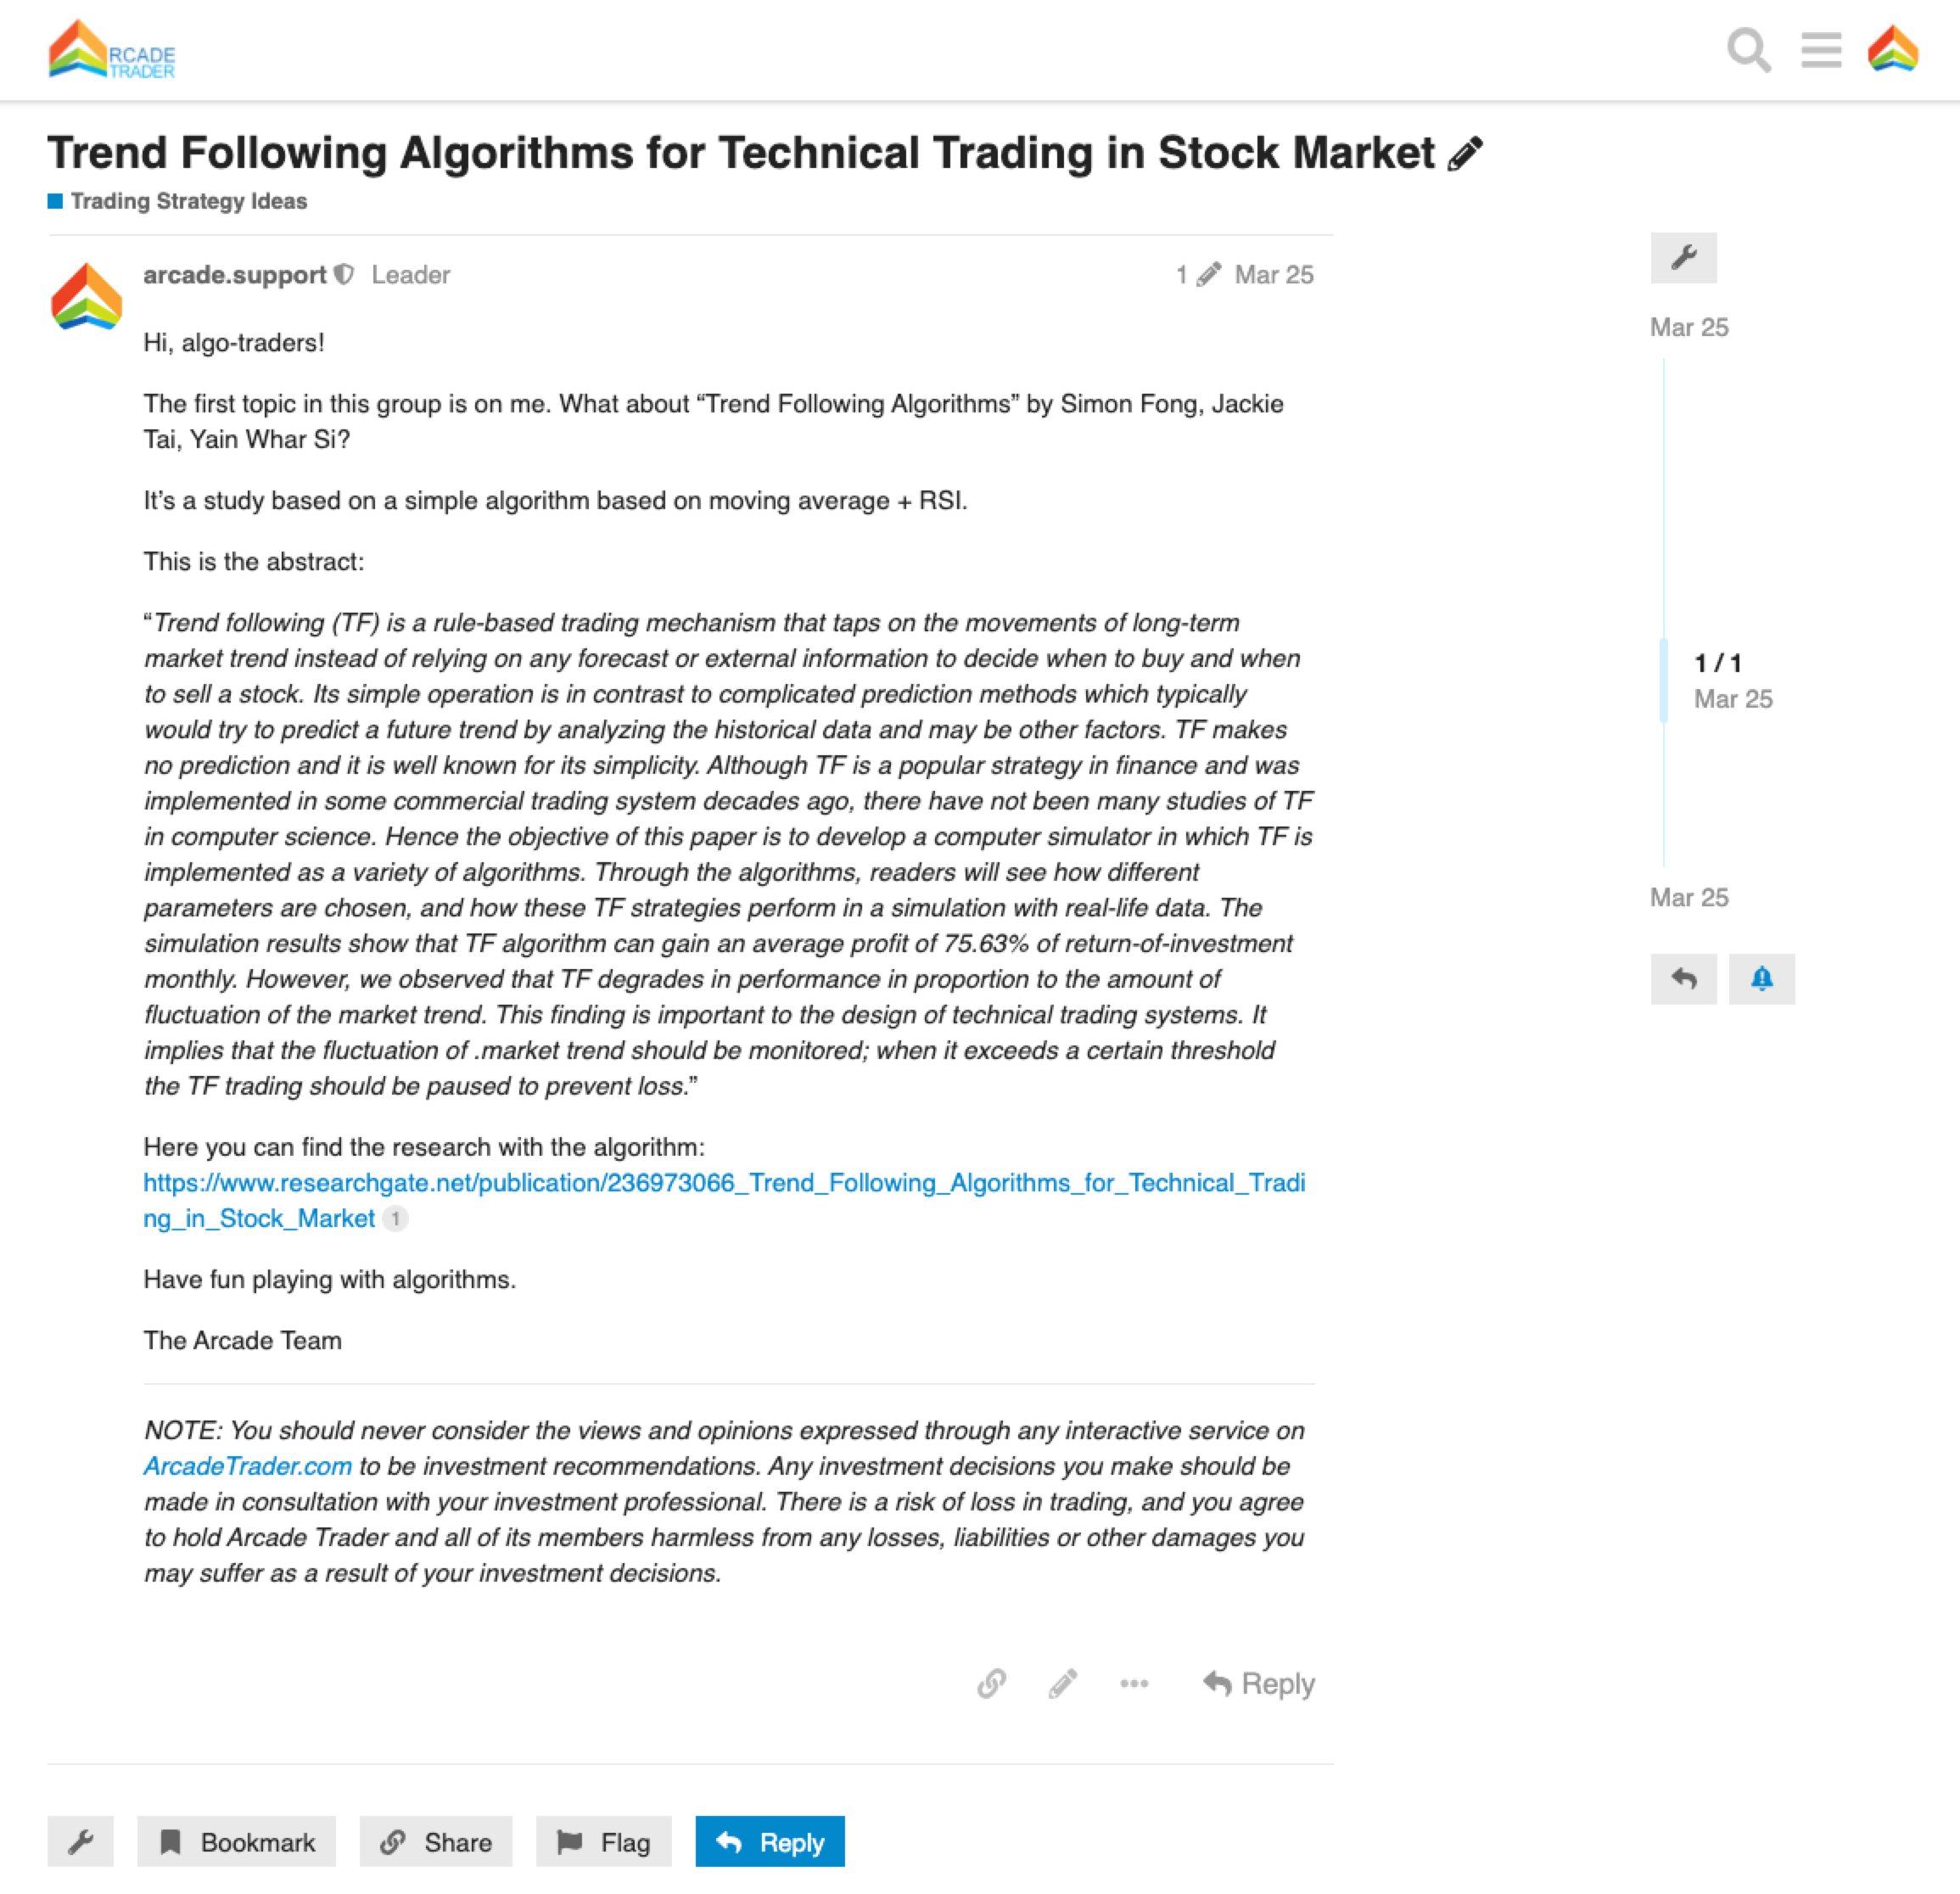
20. Community
The Community is a place open to all Arcade users where to discuss Arcade Platform, new features, issues, trading ideas, markets, etc.
All you need is an account with Arcade.
21. Market Stream Analyzer
This is an advanced feature which allows to analyze the stream of data from exchanges at the tick level. Please consider that there are millions of messages every day.
| In a second there could be 50,000 messages, so try to restrict the search as much as you can to avoid having thousands of record in the page. |
The most important filters are:
-
File Name is the market file. There is one file per day. Click on the "Load" Button to browse the available files.
-
Symbols One or more symbols seperated by comma
-
MsgId From/To is the range of message ids. Every message has an incremental id managed by Arcade. If you are opening the stream from the Live Trading page, the message id is automatically filled
-
Time From/To is the time range. During normal market hours, pick 1 minute or less because the amount of messages could be extremely high
-
Types use "T" for Trades, "Q" for quotes
-
Exchange The exchange code
-
Volume From/To Volume rangeof the single tick
-
Conditions In Condition codes to include
-
Conditions Out Condition codes to exclude
-
Timeout Timeout of the query. To avodi to overload Arcade platform with long searched, the timeout cut the result when expires. Check your subscription for the timeouts you can use.
-
Reasoning Coming soon
-
T.Price <> Q.Ask% is the range of difference between the trade price and the last ask price, as a percentage
-
T.Price <> Q.Bid% is the range of difference between the trade price and the last bid price, as a percentage
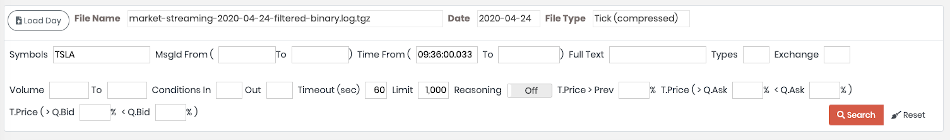
On the right you can see the output of about 5 seconds for the symbol "TSLA" on April 24th, 2019: - The yellow line is the Quote ASK Price - The Blue line is the Quote BID Price - The green line is the Trade Price |
|
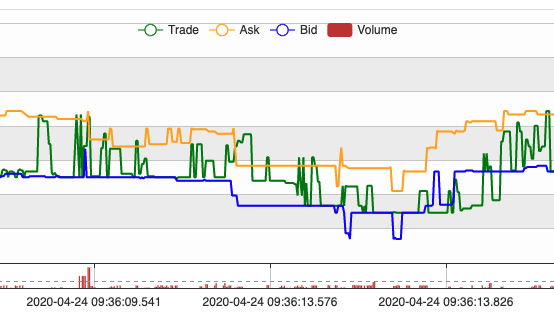
If you move the mouse ove the chart, you can see the detail of every single Tick message. |
|
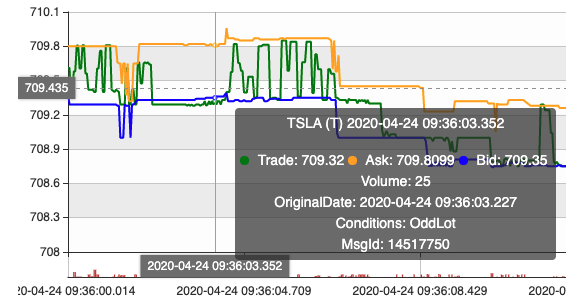
Now, click on the "Table" tab to see the same results as a table.
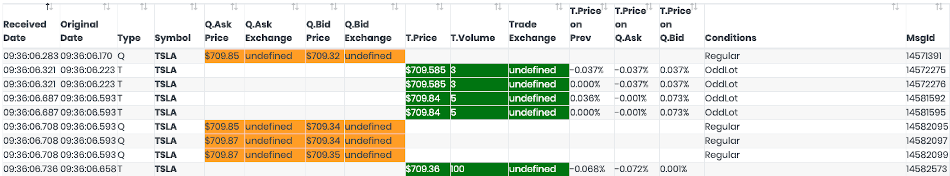
22. Enterprise Edition (On-Premise)
There are some advantages on running Arcade Trader on your own computer:
-
You can use your own resources, without the limits of the on-line subscriptions. You can also run Arcade on a cluster of multiple computers to have quicker response time on your back tests.
-
Your algorithm doesn’t live your computer. Arcade Trader doesn’t send local data to it own servers. The only information that is shared is the user credentials to check if the subscription is active.
To Run Arcade Trader locally, you need to:
-
A computer with at least 16 GB of available RAM for live trading and 8 GB of RAM for back-testing
-
Have a valid subscription that allows you to run Arcade Trader. For single users, it’s the "Professional Lab". For Hedge Funds and Banks please contact us for a quote.
-
Install Docker
-
Run Arcade Trader
-
Open Arcade Trader Platform on http://localhost:2480
-
Enter the subscription data such as registration email, user id and password
23. Architecture
Arcade Platform integrates data providers and accounts all together to provide a consistent single-view of your trades.
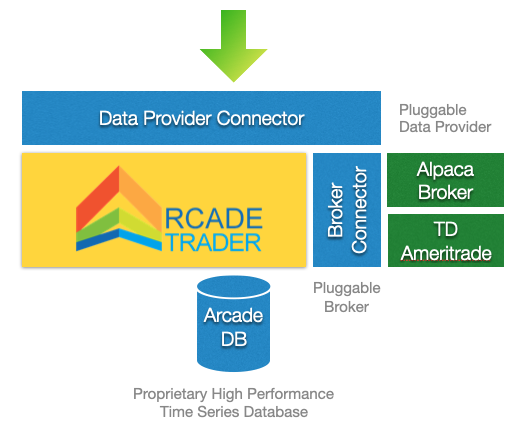
Arcade Trader uses ArcadeDB, a proprietary DBMS, to store the data relative to the user, trades, tests and market data.
24. API
Arcade Trader allows the integration with external systems by using webhooks with the following requirements:
-
Always use HTTPS
-
Always use JSON as payload and for the response
-
Always authenticate by using your Arcade user name in the
userproperty and your generated token in thetokenproperty inside of the JSON payload. The credentials are inside the JSON payload to simplify the integration with platforms that don’t allow to specify HTTP headers, like Trading View
24.1. Generate tokens
Click on "Settings" from the menu and select the tab "Connectors".
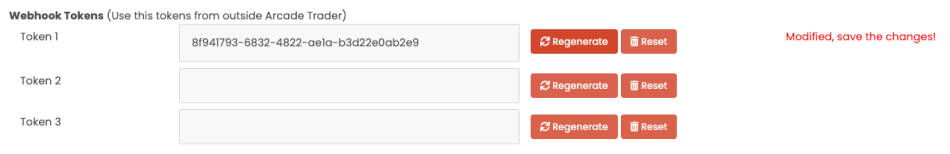
You can use up to 3 tokens. When you are not using a token anymore, please click on "Reset".
| After any changes, click on "Save" to make persistent the changes. |
24.2. Order
The Order API executes an order.
HTTP Method: POST
JSON Parameters:
Name |
Description |
Required |
Accepted Values |
Type |
account |
Arcade Account Id |
Yes |
Get the account id from Trading Accounts page |
String |
type |
Order type |
Yes |
'BUY_LONG','SELL_SHORT','SELL_LONG','BUY_TO_COVER' |
String |
symbol |
Symbol |
Yes |
Any traded symbol |
String |
quantity |
Quantity |
Yes |
1 or more |
Integer |
tif |
Time In Force |
Yes |
String |
|
limitPrice |
Limit Price |
Yes for Limit orders. 0 = market price |
Number |
Float |
timeout |
Order execution timeout in seconds |
No, default is 30 seconds |
0 = no timeout |
Integer |
Example of executing a BUY LONG order of 1 shares of TSLA with a LIMIT price:
curl https://app.arcadetrader.com/api/v2/order
     -d "{user:'myemail@gmail.com',
          token:'b25310ef-d056-4f71-9b27-0aa4371443b8',
          account:'2f36e4c5-201a-4525-b899-35deb9a4dd55',
          type: 'BUY_LONG',
          symbol: 'TSLA',
          quantity: 1,
          tif: 'limit',
          limitPrice: 720.12}"
25. Arcade Natural Language Reference

The Natural Language has been built for users with no programming skills or for not complex algorithms. The syntax is the following:
<context1> <indicator1> <operator> [<context2>] <indicator2|value> [<logic operator>]
Some examples:
-
real-time trade price is 1% above last minute close -
last minute close is above upper bollinger band -
last day 150 sma crosses above 200 sma -
last day 150 sma crosses below 200 sma and last minute close is 0.3% below 2 minutes ago close -
trade profit < -3% or trade profit > 3%(this only for End Trading section)
Context1
<context1> can be the current trade (only in End Trading section, because it is for trades that are already started) a time-related context, like:
-
real-time, for real-time data such as trade, ask, bid price. -
today, for data relative to the current day. -
last day, for data relative to the previous trading day. -
last minute, for data relative to the last minute only. -
<X> minutes ago, where<X>is an integer value. Example:10 minutes ago. -
<X> days ago, where<X>is an integer value. Example:3 days ago. -
<X> weeks ago, where<X>is an float value. Example:9.5 weeks ago. -
<X> months ago, where<X>is an float value. Example:1.5 months ago. -
<X> years ago, where<X>is an float value. Example:3 years ago.
Indicator1
<indicator1> is the indicator relative to the context <context1> used:
-
For bars (minute or day bars) you can use the followings:
-
openfor the bar’s open price. -
closefor the bar’s close price. -
highfor the bar’s highest price. -
lowfor the bar’s lowest price. -
volumefor the bar’s volume. -
rsifor the bar’s RSI (Relative Strength Index) -
vwapfor the bar’s VWAP -
upper bollinger bandfor the bar’s Upper Bollinger Band value -
lower bollinger bandfor the bar’s Lower Bollinger Band value -
macd valueis the MACD value -
macd signalis the MACD signal -
5, 10, 20, 50, 100, 150 or 200
smaorsimple moving averagefor the bar’s Simple Moving Average relative to the last X bars -
5, 10, 20, 50, 100, 150 or 200
emaorexponential moving averagefor the bar’s Exponential Moving Average relative to the last X bars -
5, 10, 20, 50, 100, 150 or 200
wmaorweighted moving averagefor the bar’s Simple Weighted Average relative to the last X bars
-
-
For
todayonly:-
gapfor the day’s gap (difference between current open price and the previous day close)
-
-
For
real-timeonly:-
trade price, as the price of the latest trade received from the real-time market connector -
trade volume, as the volume of the latest trade received from the real-time market connector -
ask price, as the ask price of the latest quote received from the real-time market connector -
ask size, as the ask size (in hundreds, 0 = odd lot) of the latest quote received from the real-time market connector -
ask exchange, as the exchange for the last ask quote received from the real-time market connector -
bid price, as the bid price of the latest quote received from the real-time market connector -
bid size, as the bid size (in hundreds, 0 = odd lot) of the latest quote received from the real-time market connector -
bid exchange, as the exchange for the last ask quote received from the real-time market connector
-
Operator
<operator> can be one of the following:
-
is equal to. Example: last minute close is equal to last minute open -
is greater than. Example: last minute close is greater than last minute open -
is <X>% greater than. Example: last minute close is 1% greater than last minute open -
is greater than or equal to. Example: today open is greater than or equal to last day close -
is less than. Example: last minute rsi is less than 50 -
is <X>% less than. Example: last minute volume is 10% less than 2 minutes ago volume -
is less than or equal to. Example: today gap is less than or equal to -3% -
is above. Example: last minute close is above 2 minutes ago close -
is <X>% above. Example: last minute close is 0.3% above 2 minutes ago close -
is below. Example: last minute low is below 2 minutes ago low -
is <X>% below. Example: today low is 5% below 3 days ago low -
is above or the same as. Example: last minute close is above or the same as last day close -
is below or the same as. Example: last minute open is below or the same as last day open -
crosses above. Example: last day 150 simple moving average crosses above 200 simple moving average -
crosses below. Example: last day 150 ema crosses below 200 ema
Context2
<context2> is like <context1> but it’s optional.
If not specified, the <context1> will be taken implicitly.
Logic Operator
<logic-operator> can be:
-
and. Example: last day 150 sma crosses above 200 sma and last minute close is 0.3% above 2 minutes ago close -
or. Example: trade profit < -3% or trade profit > 3%
25.6. Reason variables
Natural Language strategies allow to customize the "Reason In" and "Reason Out" messages by using dynamic variables from the current trade, account and bars.

To use dynamic variables, surround them with ${<variable>}. Example:
Score ${trade score} - Last Minute Close ${last minute close}
Will produce this message as "Reason In" for the trade:
Score 100 - Last Minute Close 102.23
Supported variables
-
trade symbol -
trade begin -
trade end -
trade total profit -
trade day profit -
trade purchased shares -
trade purchased price -
trade sold shares -
trade sold price -
trade strategy name -
trade reason in -
trade score -
trade cycles -
account name -
account number -
account id -
account total value -
account initial value -
account open positions -
account robots -
account type -
account maximum investing -
account cash -
account profit -
account profit on invested -
account profit on total -
account profit open positions on total -
account today trades -
account buying power -
account maximum invested -
market time -
market status -
real-time message id -
today average volume per minute -
last day average volume per minute -
last day adr high/low -
last day adr close/open -
last day average volume -
price lines -
real-time trade price -
real-time ask price -
real-time bid price -
real-time trade volume -
real-time trade date -
last minute close -
last minute open -
last minute high -
last minute low -
last minute volume -
last minute date -
last minute trades -
last minute vwap -
last minute rsi -
last minute macd value -
last minute macd signal -
last minute upper bollinger band -
last minute lower bollinger band -
last minute 5 minute sma -
last minute 5 minute simple moving average -
last minute 10 minute sma -
last minute 10 minute simple moving average -
last minute 20 minute sma -
last minute 20 minute simple moving average -
last minute 50 minute sma -
last minute 50 minute simple moving average -
last minute 100 minute sma -
last minute 100 minute simple moving average -
last minute 150 minute sma -
last minute 150 minute simple moving average -
last minute 200 minute sma -
last minute 200 minute simple moving average -
last minute 5 minute ema -
last minute 5 minute exponential moving average -
last minute 10 minute ema -
last minute 10 minute exponential moving average -
last minute 20 minute ema -
last minute 20 minute exponential moving average -
last minute 50 minute ema -
last minute 50 minute exponential moving average -
last minute 100 minute ema -
last minute 100 minute exponential moving average -
last minute 150 minute ema -
last minute 150 minute exponential moving average -
last minute 200 minute ema -
last minute 200 minute exponential moving average -
last minute 5 minute wma -
last minute 5 minute weighted moving average -
last minute 10 minute wma -
last minute 10 minute weighted moving average -
last minute 20 minute wma -
last minute 20 minute weighted moving average -
last minute 50 minute wma -
last minute 50 minute weighted moving average -
last minute 100 minute wma -
last minute 100 minute weighted moving average -
last minute 150 minute wma -
last minute 150 minute weighted moving average -
last minute 200 minute wma -
last minute 200 minute weighted moving average
26. Development Reference
The following object and function definitions are polyglot to all the supported languages. The following types are supported, check how is treated in your programming language:
Type |
Length |
Javascript |
Python |
Java |
string |
variable length |
String |
str |
String |
integer |
32-bit |
integer |
int |
int |
long |
64-bit |
integer |
int |
long |
float |
32-bit |
integer |
int |
float |
boolean |
8-bit |
boolean |
bool |
boolean |
array |
variable length |
array |
list |
List |
26.1. Object Definitions
26.1.1. Bar
A Bar object has the following properties:
-
open: the open price (float)
-
close: the close price (float)
-
low: the lowest price reached during the bar period (float)
-
high: the highest price reached during the bar period (float)
-
vwap: the VWAP calculated for the bar (float)
-
wma5: the WMA calculated for the bar from the previous 5 bars (float)
-
wma10: the WMA calculated for the bar from the previous 10 bars (float)
-
wma20: the WMA calculated for the bar from the previous 20 bars (float)
-
wma50: the WMA calculated for the bar from the previous 50 bars (float)
-
wma100: the WMA calculated for the bar from the previous 100 bars (float)
-
wma150: the WMA calculated for the bar from the previous 150 bars (float)
-
wma200: the WMA calculated for the bar from the previous 200 bars (float)
-
sma5: the SMA calculated for the bar from the previous 5 bars (float)
-
sma10: the SMA calculated for the bar from the previous 10 bars (float)
-
sma20: the SMA calculated for the bar from the previous 20 bars (float)
-
sma50: the SMA calculated for the bar from the previous 50 bars (float)
-
sma100: the SMA calculated for the bar from the previous 100 bars (float)
-
sma150: the SMA calculated for the bar from the previous 150 bars (float)
-
sma200: the SMA calculated for the bar from the previous 200 bars (float)
-
ema5: the [EMA] calculated for the bar from the previous 5 bars (float)
-
ema10: the EMA calculated for the bar from the previous 10 bars (float)
-
ema20: the EMA calculated for the bar from the previous 20 bars (float)
-
ema50: the EMA calculated for the bar from the previous 50 bars (float)
-
ema100: the EMA calculated for the bar from the previous 100 bars (float)
-
ema150: the EMA calculated for the bar from the previous 150 bars (float)
-
ema200: the EMA calculated for the bar from the previous 200 bars (float)
-
rsi: the RSI calculated fo the bar (float)
-
volume: the total volume for the bar (long)
-
avgAverage: the average volume of the last bars (long)
-
dayOfTheWeek: day of the week in string format. Days are all lowercase (string)
-
date: timestamp as epoch in milliseconds (long)
-
macd0: the low price of MACD (float)
-
macd1: the high price of MACD (float)
-
bollingerBands0: the lower Bollinger Band (float)
-
bollingerBands1: the upper Bollinger Band (float)
-
change: the difference between close and open (float)
-
changePerc: the difference, in percentage, between close and open (float)
26.1.2. Day Bar
A DayBar object extends Bar and adds the following properties:
-
atr14: the ATR calculated on the previous 14 days (float)
-
adrHighLow: the ADRHL calculated on the difference between the high price and the low price of the previous 10 days (float)
-
adrCloseOpen: the ADROC calculated on the difference between the close price and the open price of the previous 10 days (float)
-
dayOfTheWeek: the day of the week, example "Monday" (string)
You can access to such properties once you have the reference to the Bar object. Example (in Javascript):
( History.last().sma50 >= History.last().sma200  ) &&
( History.relative(-1).sma50 < History.relative(-1).sma200 );26.1.3. Symbol
| Name | Description | Return Type |
|---|---|---|
Symbol processing |
string |
|
Last trade price. Check your subscription if you are enabled to receive 'trade' tick messages |
float |
|
Last trade volume. Check your subscription if you are enabled to receive 'trade' tick messages |
long |
|
Last quote ask price. Check your subscription if you are enabled to receive 'quote' tick messages |
float |
|
Last quote ask size. Size is in hundreds of stocks. 0 means odd lot. Check your subscription if you are enabled to receive 'quote' tick messages |
int |
|
Last quote ask exchange name. Check your subscription if you are enabled to receive 'quote' tick messages |
string |
|
Last quote bid price. Check your subscription if you are enabled to receive 'quote' tick messages |
float |
|
Last quote bid size. Size is in hundreds of stocks. 0 means odd lot. Check your subscription if you are enabled to receive 'quote' tick messages |
int |
|
Last quote bid exchange name. Check your subscription if you are enabled to receive 'quote' tick messages |
string |
|
Inverted symbol if any. Example SQQQ for TQQQ and vice-versa |
string |
|
Volume of the previous day |
integer |
|
Average volume of the last period |
integer |
|
Average Day Range considering High/Low of the day |
float |
|
Average Day Range considering Close/Open of the day |
float |
|
Market Cap |
integer |
|
Number of shares available on the market |
integer |
|
Full Name |
string |
|
Description |
string |
|
Country |
string |
|
Shares Type: CS=Common Stocks, ETF=Exchange Traded Funds, and others |
string |
|
Name of the exchange that manage the symbol |
string |
|
Sector |
string |
|
Industry |
string |
|
Total Yearly Revenue |
integer |
|
Total shares outstanding |
integer |
|
Number of employees |
integer |
|
Stock Splits returned as a list of objects with the day (string) and factor (float) |
array |
|
If the symbol is an ETF, returns the holdings as an array of symbol (string) and weight (float) |
array |
|
Easy To Borrow |
boolean |
26.1.5. History
| Name | Description | Return Type |
|---|---|---|
Change the current symbol. By default is set with the current symbol in context. Example: |
History |
|
Bar at the absolute position in history. Example to return the close value of the first bar in history: |
||
Bar X days ago from today. |
||
Bar X weeks ago from today. You can use decimals, for example |
||
Bar X months ago from today. You can use decimals, for example |
||
Bar X years ago from today. You can use decimals, for example |
||
Find a date. If not found and closestIfNotFound is true, then the closest date us returned |
||
Returns the list of days |
||
Extract a subset of days by passing a from/to range as relative numbers to move forward, negative numbers for backwards. Example: |
||
Bar from the last day. It's equivalent of |
||
First Bar found in history. Example to return the volume of the first bar: |
||
Highest price on close, in the last 52 weeks |
float |
|
Lowest price, on close, in the last 52 weeks |
float |
|
Highest price, specifying the value type (close, open, etc.) and the number of the last days to consider |
float |
|
Highest price, specifying the value type (close, open, etc.) and the number of the last days to consider |
float |
|
The closer Support Level (if any) computed on the available history bars from the previous day close price. You can pass the minimum strength, or 1 will be used by default. The returning object is a PriceLevel with the following properties:
History.supportLevel(3).price
|
PriceLevel |
|
The closer Resistance Level (if any) computed on the intraday bars from the previous day close price. You can pass the minimum strength, or 1 will be used by default. The returning object is a PriceLevel with the following properties:
History.resistanceLevel().price
|
PriceLevel |
|
Support and resistance levels computed on the available history bars. Each level object has the following properties:
History.priceLevels[0].price
|
array |
|
Returns the bars in Heikin Ashi format. |
array |
|
Returns the Average True Range computed from the last bar to 'length' (14 by default) bars back multiplied by the multiplier (1 by default) |
float |
26.1.6. Market
| Name | Description | Return Type |
|---|---|---|
Market status between ['Pre', 'Regular', 'Post', 'Off' ] |
string |
|
Timestamp of last connection to the realtime market streaming |
long |
|
Minutes from the opening of the interested market between ['Pre', 'Regular', 'Post', 'Off' ]. By default is Regular |
integer |
|
Minutes to the closing of the interested market between ['Pre', 'Regular', 'Post', 'Off' ]. By default is Regular |
integer |
|
Current market time as a formatted string. It takes the datetime format in input. If null 'yyyy-MM-dd HH:mm:ss.SSS' is used |
string |
|
Current market time as Calendar object |
calendar |
|
Current market time as timestamp in UNIX time with milliseconds |
long |
|
Map of the requested earnings as an array of strings with one or more of the following values: BMO, AMC, UNKNOWN, PDAMC. The returning map has the symbol as key and the event date as value between: BMO, AMC, UNKNOWN, PDAMC |
object |
26.1.7. Intraday
26.1.8. Indicators
26.1.9. Account
| Name | Description | Return Type |
|---|---|---|
Return the active robot for a symbol if any. Example: |
Robot |
|
Return the active robots. Example: |
array |
|
Return the active robots for a particular strategy name. Example: |
Robot |
|
Arcade’s Account Id |
string |
|
Arcade’s Account Name |
string |
|
Broker’s Account Number |
string |
|
Account Type between [alpaca-live, alpaca-paper, tdameritrade-live] |
string |
|
Initial amount at the beginning of the day |
float |
|
Total value of the account updated in real-time. This is the sum of cash and the total of the open positions |
float |
|
Buying Power updated in real-time |
float |
|
Buying Power updated in real-time considering day trading activity. For some broker this is the same as for buying power |
float |
|
Amount available to be invested. based on the account settings, can be the total of cash (default) or the buying power. This amount is influenced by broker restriction with margin and how it computes the daily buying power |
float |
|
Minimum amount of cash available today in the account |
float |
|
Maximum amount of cash available today in the account |
float |
|
Maximum amount available to invest. If zero is equals to availableToInvest() |
float |
|
Maximum amount of cash invested today |
float |
|
Number of trades executed today |
int |
|
Number of active robots for this account |
int |
|
Number of robots that have finished trading for this account |
int |
|
Force a synchronization with the broker to update cached values (total, positions, orders, etc.) |
void |
|
Return true if the account is active, otherwise false |
boolean |
|
Return the settings if robots can begin new tradings |
boolean |
|
Change the settings if robots can begin new tradings |
void |
|
Return the settings if robots can end existent tradings |
boolean |
|
Change the settings if robots can end existent tradings |
void |
|
Return Broker information |
object |
|
Cancels all the pending orders relative to a symbol. It returns true if there are some pending orders on the requested symbol, otherwise false. This operation is asynchronous |
boolean |
|
Total pending orders relative to a symbol |
integer |
|
Total shares in open positions relative to a symbol |
integer |
26.1.10. Robot
26.1.11. Format
| Name | Description | Return Type |
|---|---|---|
Formats a date. Example: |
string |
|
Parses a date and returns a timestamp. Example: |
string |
|
Formats a float number into a currency by prefixing the amount with the dollar sign ($) and formatting the amount with comma separator for every thousands and a custom number of decimals. Example: |
string |
|
Formats a decimal number by formatting the amount with comma separator for every thousands and a custom number of decimals. Example: |
string |
26.1.12. Statistics
| Name | Description | Return Type |
|---|---|---|
Difference between two number in percent. Example: |
float |
26.1.13. Signal
| Name | Description | Return Type |
|---|---|---|
Algorithm name which generated the signal |
string |
|
Order type between 'BUY_LONG', 'SELL_LONG', 'SELL_SHORT', 'BUY_TO_COVER' received from the signal |
string |
|
Symbol received from the signal |
string |
|
Price to buy received from the signal |
float |
|
Quantity to buy. It can be 0 |
integer |
|
Timestamp when the signal was generated |
long |
|
Timestamp when the signal was received by Arcade Trader |
long |
27. Glossary
Technical explanation are taken from Investopedia with the link to the original source so you can expand the concept directly on Investopedia website.
- ADR H/L
-
Average Delta Range considering High/Low prices
- ADR O/C
-
Average Delta Range considering Open/Close prices
- AMC
-
After Market Close
- ATR
-
Average true range (ATR) is a technical indicator measuring market volatility. It is typically derived from the 14-day moving average of a series of true range indicators. More
- BMO
-
Before Market Open
- Bollinger bands
-
A Bollinger Band® is a technical analysis tool defined by a set of lines plotted two standard deviations (positively and negatively) away from a simple moving average ([SMA]) of the security’s price, but can be adjusted to user preferences. Bollinger Bands® were developed and copyrighted by famous technical trader John Bollinger. More
- Only At Close (CLS)
-
Use this with a market/limit order type to submit “market on close” (MOC) and “limit on close” (LOC) orders. This order is eligible to execute only in the market closing auction. Any unfilled orders after the close will be cancelled. CLS orders submitted after 3:50pm but before 7:00pm ET will be rejected. CLS orders submitted after 7:00pm will be queued and routed to the following day’s closing auction.
- Day (Time In Force)
-
A day order is eligible for execution only on the day it is live + extended hours.
- Consolidation
-
Consolidation is a technical analysis term referring to security prices oscillating within a corridor and is generally interpreted as market indecisiveness. Said another way, consolidation is used in technical analysis to describe the movement of a stock’s price within a well-defined pattern of trading levels. Consolidation is generally regarded as a period of indecision, which ends when the price of the asset moves above or below the prices in the trading pattern. More
- Dividend
-
A dividend is the distribution of a portion of the company’s earnings, decided and managed by the company’s board of directors, and paid to a class of its shareholders. Dividends must be approved by the shareholders through their voting rights. Although cash dividends are the most common, dividends can also be issued as shares of stock or other property. Along with companies, various mutual funds and exchange-traded funds (ETF) also pay dividends. More
- Earnings
-
Earnings typically refer to after-tax net income, sometimes known as the bottom line or a company’s profits. Earnings are the main determinant of a company’s share price, because earnings and the circumstances relating to them can indicate whether the business will be profitable and successful in the long run. Earnings are perhaps the single most important and most studied number in a company’s financial statements. It shows profitability compared to analyst estimates, the company’s own historical performance, and relative to its competitors and industry peers. More
- EMA
-
An exponential moving average (EMA) is a type of moving average (MA) that places a greater weight and significance on the most recent data points. The exponential moving average is also referred to as the exponentially weighted moving average. An exponentially weighted moving average reacts more significantly to recent price changes than a simple moving average ([SMA]), which applies an equal weight to all observations in the period. Look also at [SMA] and [WMA]. More
- Extended Trading Hours
-
Extended trading is trading conducted by electronic networks either before or after the regular trading hours of the listing exchange. Such trading tends to be limited in volume compared to regular trading hours when the exchange is open. Pre-market trading in the United States, in terms of stocks, usually runs between 4:00 a.m. and 9:30 a.m. Eastern Time and after-hours trading typically runs from 4:00 p.m. to 8:00 p.m. Eastern Time (EST). The U.S. stock exchanges are open from 9:30 a.m. to 4:00 p.m. EST. More]
- Fill or Kill (FOK)
-
It is only executed if the entire order quantity can be filled, otherwise the order is canceled.
- Good Til Canceled (GTC)
-
The order is good until canceled.
- High Frequency Trading
-
High-frequency trading, also known as HFT, is a method of trading that uses powerful computer programs to transact a large number of orders in fractions of a second. It uses complex algorithms to analyze multiple markets and execute orders based on market conditions. Typically, the traders with the fastest execution speeds are more profitable than traders with slower execution speeds. In addition to the high speed of orders, high-frequency trading is also characterized by high turnover rates and order-to-trade ratios. Some of the best-known high-frequency trading firms include Tower Research, Citadel LLC and Virtu Financial. More
- Immediate Or Cancel (IOC)
-
It Requires all or part of the order to be executed immediately.
- Limit Order
-
A buy limit order is an order to purchase an asset at or below a specified price, allowing traders to control how much they pay. By using a limit order to make a purchase, the investor is guaranteed to pay that price or less. While the price is guaranteed, the order being filled is not. If the asset does not reach the specified price, the order is not filled and the investor may miss out on the trading opportunity. Said another way, by using a buy limit order the investor is guaranteed to pay the buy limit order price or better, but it is not guaranteed that the order will be filled. More
- Linear Regression Channel
-
The Linear Regression Channel (LRC) gives objective buy and sell signals based on price volatility. The upper and lower channels (linear regression lines) contain between themselves either 68% of all prices (if one Standard Deviation is used) or 95% of all prices (if two Standard Deviations are used). When prices break outside of the channels, either Buy or Sell opportunities are present, or else the prior trend could be ending. When price falls below the lower channel line, a Buy signal is usually triggered and when prices break above the upper channel line, an opportunity for Selling occurs. Also, when price closes outside of the Linear Regression Channel for long periods of time, this is often interpreted as an early signal that the past price trend may be breaking and a significant reversal could be near. The Linear Regression Channel is a very useful technical analysis charting tool. In addition to identifying trends and trend direction, the use of standard deviation gives you an idea as to when prices are becoming overbought or oversold relative to the current trend. Said another way, by using a buy limit order the investor is guaranteed to pay the buy limit order price or better, but it is not guaranteed that the order will be filled. More
- Loss
-
Any kind of loss is always represented in red
- MACD
-
Moving Average Convergence Divergence (MACD) is a trend-following momentum indicator that shows the relationship between two moving averages of a security’s price. The MACD is calculated by subtracting the 26-period Exponential Moving Average (EMA) from the 12-period EMA. The result of that calculation is the MACD line. A nine-day EMA of the MACD called the "signal line," is then plotted on top of the MACD line, which can function as a trigger for buy and sell signals. Traders may buy the security when the MACD crosses above its signal line and sell - or short - the security when the MACD crosses below the signal line. Moving Average Convergence Divergence (MACD) indicators can be interpreted in several ways, but the more common methods are crossovers, divergences, and rapid rises/falls. More
- Market Order
-
Market orders are transactions meant to execute as quickly as possible at the current market price. Market orders offer a greater likelihood that an order will go through, but there are no guarantees, as orders are subject to availability. More
- Order Type
-
Can be [LimitOrder] or [MarketOrder]
- Only At Open (OPG)
-
Use this with a market/limit order type to submit “market on open” (MOO) and “limit on open” (LOO) orders. This order is eligible to execute only in the market opening auction. Any unfilled orders after the open will be cancelled. OPG orders submitted after 9:28am but before 7:00pm ET will be rejected. OPG orders submitted after 7:00pm will be queued and routed to the following day’s opening auction.
- PDAMC
-
Previous Day After Market Close. it means the earnings were announced after the market closing of the previous trading day
- Profit
-
Any kind of profit is always represented in green
- Resistance Level
-
Resistance, or a resistance level, is the price at which the the price of an asset meets pressure on its way up by the emergence of a growing number of sellers who wish to sell at that price. Resistance levels can be short-lived if new information comes to light that changes the overall market’s attitude toward the asset, or they can be long-lasting. In terms of technical analysis, the simple resistance level can be charted by drawing a line along the highest highs for the time period being considered. Resistance can be contrasted with support. More
- Robot
-
Represents a piece of software that implement the user selected strategy to begin and end a trade. Multiple robots of the same of different strategy can run in the same account. Multiple robots can’t trade the same symbol.
- RSI
-
The relative strength index (RSI) is a momentum indicator that measures the magnitude of recent price changes to evaluate overbought or oversold conditions in the price of a stock or other asset. The RSI is displayed as an oscillator (a line graph that moves between two extremes) and can have a reading from 0 to 100. The indicator was originally developed by J. Welles Wilder Jr. and introduced in his seminal 1978 book, "New Concepts in Technical Trading Systems.". More
- Score
-
It’s a score, from 0 to 100, assigned by the strategy beginTrading() function to determine the level of confidence in the trade. If the "Max Inv. per Trade" for a strategy is $1,000, a score = 100 means 100% of $1,000 will be invested. A score = 50 means 50% of the amount will be used, namely $500
- Standard Deviation
-
The standard deviation is a statistic that measures the dispersion of a dataset relative to its mean and is calculated as the square root of the variance. It is calculated as the square root of variance by determining the variation between each data point relative to the mean. If the data points are further from the mean, there is a higher deviation within the data set; thus, the more spread out the data, the higher the standard deviation. More
- Support Level
-
Support, or a support level, refers to the price level that an asset does not fall below for period of time. An asset’s support level is created by buyers entering the market whenever the asset dips to a lower price. In technical analysis, the simple support level can be charted by drawing a line along the lowest lows for the time period being considered. The support line can be flat or slanted up or down with the overall price trend. Other technical indicators and charting techniques can be used to identify more advanced versions of support. More
- Symbol
-
Stock symbol
- Timeout
-
Wait the specified number of seconds, otherwise cancels it. It is eligible for execution only on the day it is live + extended hours.
- Tick
-
A tick is a measure of the minimum upward or downward movement in the price of a security. A tick can also refer to the change in the price of a security from one trade to the next trade. Since 2001 and the advent of decimalization, the minimum tick size for stocks trading above $1 is one cent. More
- Trades
-
As a metric is the number of individual trades. This is an exclusive metric, and it’s quite different from the volume. While the volume collects the total number of traded shares, Trades are the number of individual trades. For example, if a big institution bought 100K shares, the volume would be 100K, but the trades only 1. This metric is important to understand how many players are in the game for that stock in a particular period of time.
- VWAP
-
The volume weighted average price (VWAP) is a trading benchmark used by traders that gives the average price a security has traded at throughout the day, based on both volume and price. It is important because it provides traders with insight into both the trend and value of a security. Look also at [EMA] and [SMA] and [WMA]. More
- Weekly Report
-
It’s a report, such as OIL Report and Natural GAS Report
- WMA
-
Weighted Moving Averages are like [SMA], but they assign a heavier weighting to more current data points since they are more relevant than data points in the distant past. The sum of the weighting should add up to 1 (or 100 percent). In the case of the simple moving average, the weightings are equally distributed. The weighted average is calculated by multiplying the given price by its associated weighting and totaling the values. Look also at [EMA] and [SMA]. More
| Any example contained in this document is for academic purposes only. Arcade Data is not suggesting using a particular strategy or providing any financial advice. For more information, check the Risk Disclaimer. |
All the trademarks different than Arcade Trader, Arcade Data and ArcadeDB are property of their owner. Arcade Data LTD does not own such trademarks.